
Cosine Function Graph by Roger Lui
Loading the math board and drawing, please wait…
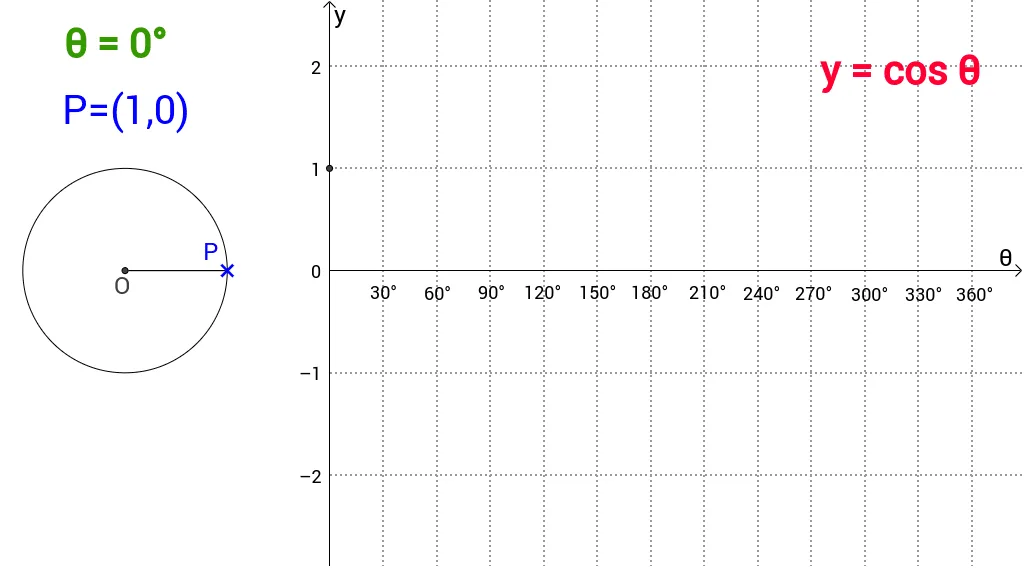
This example demonstrates how to generate a cosine function graph from a unit circle. Key mathematical concepts include trigonometry. Using GeoGebra commands such as Point, Segment, Angle, etc., the nature of the cosine function can be dynamically illustrated. Suitable for high school mathematics education and learning.
GeoGebra Commands & Parameters
Point(c) → PSegment(P, O) → aSegment(B, O) → bAngle(B, O, P) → αText("30°") → text1Text("60°") → text2Text("90°") → text3Text("120°") → text4Text("150°") → text5Text("180°") → text6Text("360°") → text7Text("210°") → text8Text("240°") → text9Text("270°") → text10Text("300°") → text11Text("330°") → text12Text("θ = " * α) → text13Text("P=(" * e * "," * d * ")") → text14Text("y = cos θ") → text15
AI Drawing Prompt Reference
Draw a unit circle and select several key angle points such as 30°, 60°, 90°, etc. Connect these points to the center to form chords. Label these angles and show their coordinates at each point. Finally, demonstrate the relationship between the cosine function and the y-axis, i.e., y = cos θ.
The prompt above was compiled from the original drawing commands and is for reference only.