
Graphing Sine and Cosine Using the Unit Circle
Loading the math board and drawing, please wait…
In collections
MA440
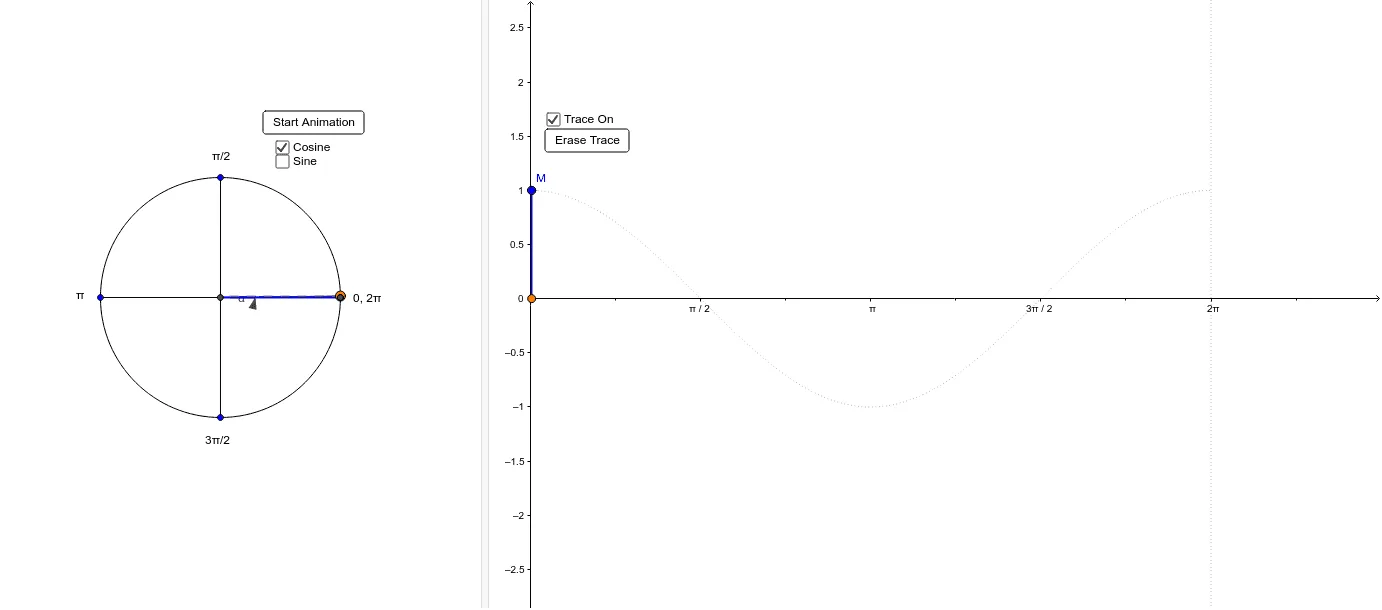
This GeoGebra example dynamically illustrates how sine and cosine functions are generated from the unit circle. It visually connects circular motion to periodic function graphs, helping learners understand the geometric definition of trigonometric ratios, periodicity, and symmetry. Construction uses GeoGebra commands such as Intersect, Circle, Point, Segment, Angle, and If to build the unit circle, measure angles, and conditionally generate function points. Ideal for high school trigonometry, precalculus, or calculus introduction courses, it bridges geometric intuition and algebraic representation.
GeoGebra Commands & Parameters
Intersect(xAxis, yAxis) → ACircle(A, 1) → cPoint(c) → BSegment(A, B) → aAngle(C, A, B) → αSegment(D, F) → bSegment(E, C) → dIf(0 ≤ x ≤ 6.28319, sin(x)) → fIf(0 ≤ x ≤ 6.28319, cos(x)) → gSegment(A, G) → eSegment(B, G) → hSegment(B, H) → iSegment(J, I) → jSegment(I, L) → kSegment(B, G) → p