
Hyperbola from the Definition
Loading the math board and drawing, please wait…
In collections
MA440
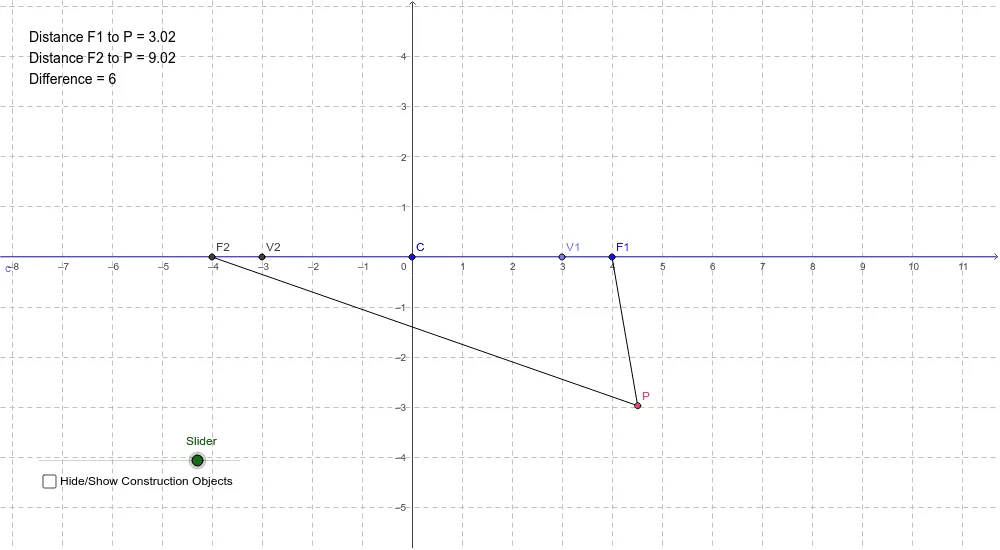
① This GeoGebra example dynamically demonstrates the definition of a hyperbola: the locus of points where the absolute difference of distances to two fixed foci (F1, F2) is constant. ② Core mathematical concepts include conic sections, hyperbola definition, foci, vertices, transverse axis, and asymptotes. ③ Construction highlights: using commands such as Ray, Segment, Point, Line, Circle, Intersect, Rotate, Angle, Midpoint, and OrthogonalLine, the construction creates foci F1 and F2, vertices V1 and V2, a slider β, and a dynamic point P, along with auxiliary lines and circles to trace the locus satisfying the distance-difference condition. ④ Suitable for high school analytic geometry or college conic sections courses, this interactive tool helps students visualize the generation of a hyperbola and explore its properties, and can be used for classroom demonstrations or self-directed learning.
GeoGebra Commands & Parameters
Ray(C, F1) → aSegment(C, F1) → bPoint(b) → V1Line(C, F1) → cCircle(C, V1) → dCircle(C, F1) → eIntersect(d, c, 2) → V2Intersect(e, c, 2) → F2Segment(V2, V1) → fCircle(F1, f) → gPoint(g) → ARotate(A, Slider, F1) → BAngle(A, F1, B) → βLine(F1, B) → hSegment(F2, B) → iMidpoint(i) → DOrthogonalLine(D, i) → jIntersect(h, j) → PSegment(F2, P) → kSegment(P, F1) → l
AI Drawing Prompt Reference
Draw a hyperbola demonstrating its definition as the locus of points where the absolute difference of distances to two fixed foci is constant. Start by plotting the foci and vertices, then use a slider and a dynamic point, along with auxiliary circles and lines, to trace the locus satisfying the distance-difference condition and show the asymptotes.
The prompt above was compiled from the original drawing commands and is for reference only.