
Normal Distribution Demo by nathank297
Loading the math board and drawing, please wait…
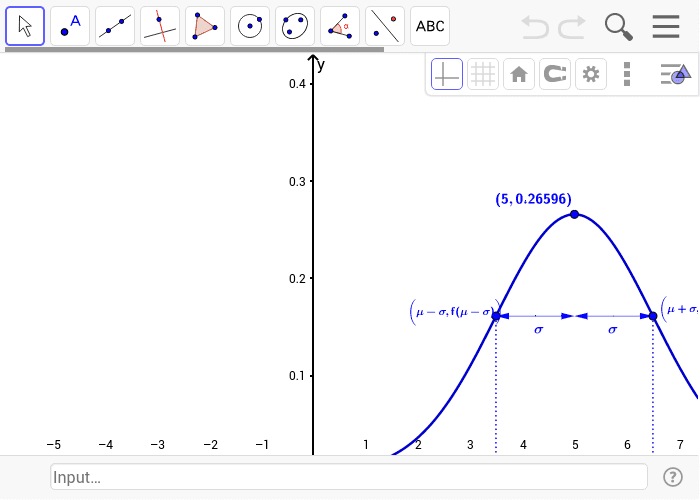
This example demonstrates the characteristics and properties of the normal distribution. It involves core mathematical concepts such as the normal distribution function, mean (μ), standard deviation (σ), derivatives, integrals, and symmetry. Construction highlights include using GeoGebra commands like Function for plotting functions, Integral for calculating areas, Segment for drawing segments, Vector for creating vectors, Intersect for finding intersections, Line for drawing lines, and Midpoint for locating midpoints, with objects like σ, μ, f, AreaUnder_1, f', f'' involved. Suitable for high school students and math enthusiasts studying probability, statistics, and calculus.
GeoGebra Commands & Parameters
Function(1 / (σ * sqrt(2 * π)) * ℯ^((-1) / 2 * ((x - μ) / σ)^(2)), μ - 4 * σ, μ + 4 * σ) → fIntegral(f, μ - σ'sFromμ * σ, μ + σ'sFromμ * σ) → AreaUnder_1Function(-1 / σ * f(x) * (x - μ) / σ, μ - 4 * σ, μ + 4 * σ) → Tryf'Function(-1 / σ * f(x) * (1 / σ - (x - μ)^(2) / σ^(3)), μ - 4 * σ, μ + 4 * σ) → Tryf''Segment(LeftSigAxis, LeftSigmas) → aSegment(RightSigAxis, RightSigmas) → bSegment(Top, BelowCenter) → CenterVector(BelowCenter, LeftSigmas) → uVector(BelowCenter, RightSigmas) → vIntersect(Tryf'', c, (0.016520303553255872, 0.004758230473098036)) → BIntersect(Tryf'', c, (0.016520303553255872, 0.004758230473098036)) → CLine(B, yAxis) → dLine(C, yAxis) → eIntersect(f, d, (0.016520303553255872, 0.0010665692819559207)) → DIntersect(f, e, (0.016520303553255872, 0.0010665692819559207)) → ESegment(D, B) → gSegment(E, C) → hVector((μ + 4 * σ, f(μ + 4 * σ)), (μ + 4.25 * σ, f(μ + 4.25 * σ))) → RightArrowVector((μ - 4 * σ, f(μ - 4 * σ)), (μ - 4.25 * σ, f(μ - 4.25 * σ))) → LeftArrowSegment(LeftInflect, SecondDerivLeftZero) → iSegment(RightInflect, SecondDerivativeRightZero) → jSegment(FMax, MuZero) → kSegment(LeftInflect, RightInflect) → lMidpoint(l) → AMidpoint(A, LeftInflect) → FMidpoint(A, RightInflect) → GVector(F, A) → wVector(F, LeftInflect) → zVector(G, A) → mVector(G, RightInflect) → n
AI Drawing Prompt Reference
Draw a normal distribution curve, marking the mean and standard deviation, and show its symmetry with integral areas and derivative curves. Start by plotting the normal distribution function, then mark the mean μ and standard deviation σ, draw the integral area of the curve, and then plot the first and second derivative curves, highlighting the inflection points. Finally, use line segments and vectors to indicate the symmetry axis, inflection points, extrema, and key feature points of the curve to complete the drawing.
The prompt above was compiled from the original drawing commands and is for reference only.