
Visualizing Data Spread Measures
Loading the math board and drawing, please wait…
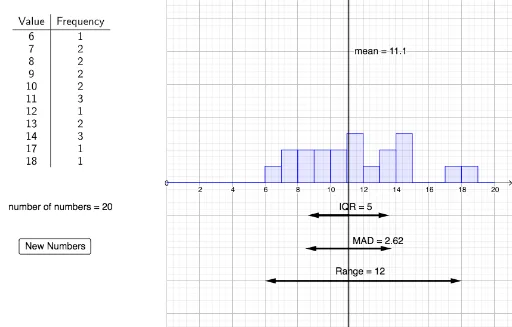
This example demonstrates how to visualize mean, range, IQR, and MAD for a dataset using GeoGebra. It involves core statistical concepts and utilizes commands like FrequencyTable, mean, mad, and Histogram. Ideal for high school students learning statistics and data analysis.
GeoGebra Commands & Parameters
FrequencyTable(Numbers) → text1Unique(Numbers) → Listmean(Numbers) → MeanNumbersMedian(Numbers) → MedianNumbersmad(Numbers) → meanAbsoluteDeviationFrequency(Numbers) → FrequenciesSequence(n, n, 0, 20) → BoundariesHistogram(Boundaries, Numbers, true) → histogramDisplayIntersect(meanX, f) → IPoint(meanX) → JPoint(meanX) → KCircle(J, IQR / 2) → eCircle(K, meanAbsoluteDeviation) → gLine(J, f) → hLine(K, f) → iIntersect(e, h, 1) → LIntersect(e, h, 2) → MIntersect(g, i, 2) → NIntersect(g, i, 1) → OVector(J, M) → uVector(K, O) → vVector(K, N) → wVector(J, L) → aPoint(meanX) → ALine(A, f) → jVector(A, B) → bVector(A, C) → c