
Venn Diagram with Intersection and Union
Loading the math board and drawing, please wait…
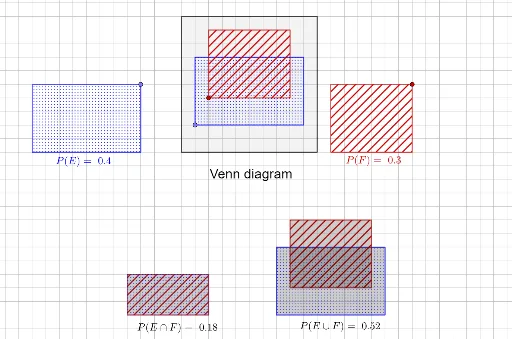
This example demonstrates the graphical representation of Venn diagrams, including intersections and unions. It involves core mathematical concepts such as set theory operations (intersection, union) and geometric visualization. The construction utilizes GeoGebra commands and objects like PointIn, Max, Min, Polygon, If, along with elements like EorFoutbase, Fbase, Ucorners, etc., to build and compute regions. It is suitable for high school mathematics or discrete mathematics courses teaching set operations and geometric constructions.
GeoGebra Commands & Parameters
PointIn(Polygon[Fbase + Ucorners]) → FcornerPointIn(Polygon[{(0, 0), (10 - Fwidth, 0), (10 - Fwidth, 10 - Fheight), (0, 10 - Fheight)}]) → FareabasePointIn(Polygon[Ebase + Ucorners]) → EcornerPointIn(Polygon[{(0, 0), (10 - Ewidth, 0), (10 - Ewidth, 10 - Eheight), (0, 10 - Eheight)}]) → EareabaseMax(Eleft, Fleft) → EFleftMin(Eright, Fright) → EFrightMax(Ebottom, Fbottom) → EFbottomMin(Etop, Ftop) → EFtopPolygon(Ucorners) → UareaPolygon(Eareabase + Ecorners) → EareaPolygon((EFleft, EFbottom) + EFcorners) → EFrectPolygon(Fareabase + Fcorners) → FareaIf(noshowEF, 0, EFrect) → EFareaPolygon(Ebase + Ecorners) → ErectPolygon(Fbase + Fcorners) → FrectPolygon(EandFoutbase + EFcorners) → EandFoutPolygon(EorFoutbase - unioncorner + Eareabase + Ecorners) → EoutPolygon(EorFoutbase - unioncorner + Fareabase + Fcorners) → Fout
AI Drawing Prompt Reference
Draw a Venn diagram with two overlapping rectangles E and F inside a larger rectangle U. First outline U, then draw the full rectangles for E and F. Highlight the intersection area of E and F with shading or color. Then show the parts of E not in F, the parts of F not in E, and the union of E and F. Clearly distinguish each region and label the intersection and union.
The prompt above was compiled from the original drawing commands and is for reference only.