
Binomial Distribution with 1000 Trials - Dynamic Bar Chart
Loading the math board and drawing, please wait…
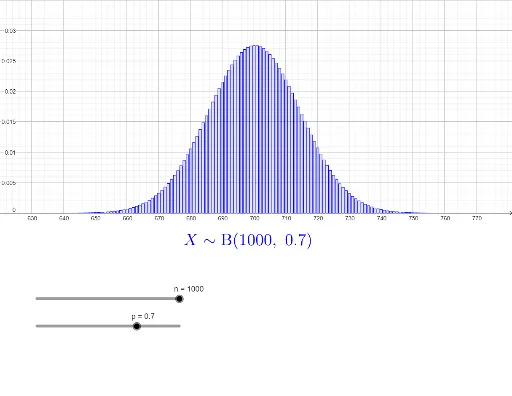
① This GeoGebra example demonstrates the probability distribution of a binomial experiment with 1000 trials using a dynamic bar chart, showing how probabilities vary across different numbers of successes. ② The core mathematical concept is the binomial distribution, involving parameters n (number of trials) and p (probability of success), along with the probability mass function and its visualization. ③ Construction details: The Sequence command generates the sequence of trial counts, BarChart creates the bar chart, and objects such as n, p, thexs (success counts), thefreqs (frequencies), thedist (distribution values), ymax/ymin/xmax/xmin (coordinate ranges), and text1 (text label) are defined. Sliders allow real-time adjustment of parameters to update the graph. ④ Suitable for high school and university probability and statistics courses, this tool helps students understand how the binomial distribution shape changes with n and p, and serves as an interactive demonstration for teachers or self-study.
GeoGebra Commands & Parameters
Sequence(0, n) → thexsSequence(BinomialDist[n, p, k, false], k, 0, n) → thefreqsBarChart(thexs, thefreqs, 0.8) → thedist
AI Drawing Prompt Reference
Create a dynamic bar chart to illustrate the binomial distribution for 1000 trials, with sliders to adjust the number of trials and the probability of success in real-time. The height of each bar represents the probability of different numbers of successes, generated by sequences for success counts and calculated probabilities for the bar chart.
The prompt above was compiled from the original drawing commands and is for reference only.