
Binomial Distribution: Mode, Median, Expected Value, and Standard Deviation
Loading the math board and drawing, please wait…
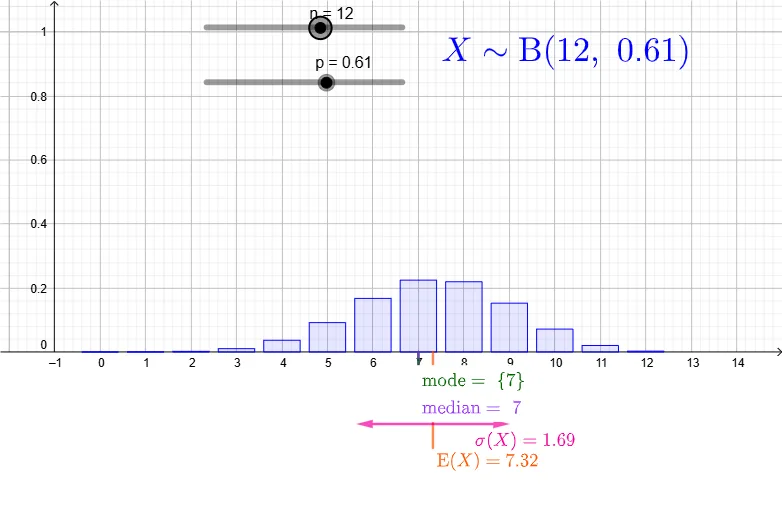
This GeoGebra example dynamically visualizes the probability mass function of a binomial distribution using a bar chart, while simultaneously highlighting its mode, median, expected value, and standard deviation. Core mathematical concepts include binomial probability calculations, discrete random variable characteristics (mean, variance, standard deviation), the mode (value with highest probability), and the median (value where cumulative probability reaches 0.5). Construction details: the Sequence command generates the value range, BarChart plots the distribution, Median computes the median, If and Length handle conditional counting, and Segment/Vector draw auxiliary lines for the mean, standard deviation intervals, and mode position. Sliders n and p allow real-time parameter adjustment, updating all statistics and their graphical positions. Suitable for high school or college probability and statistics courses, this tool helps students understand how the shape of a binomial distribution changes with parameters and how the mode, median, and mean differ in skewed distributions.
GeoGebra Commands & Parameters
Sequence(0, n) → thexsSequence(BinomialDist[n, p, k, false], k, 0, n) → thefreqsBarChart(thexs, thefreqs, 0.8) → thedistMedian(thexs, (thefreqs * 100)) → themedianIf(p ≟ 1, {n}, If[p ≟ 0, {0}, If[IsInteger[((n + 1) * p)], {((n + 1) * p) - 1, ((n + 1) * p)}, {floor(((n + 1) * p))}]]) → themodeLength(themode) → nummodeSegment((themean, (meandepth * ymin)), (themean, 0)) → meanposSegment((themedian, (mediandepth * ymin)), (themedian, 0)) → meadianposSequence(Segment[(themode(i), ((1 / 2 * modedepth) * ymin)), (themode(i), 0)], i, 1, nummode) → modeposSegment((Min[themode], ((1 / 2 * modedepth) * ymin)), (Max[themode], ((1 / 2 * modedepth) * ymin))) → modebarSegment(((Min[themode] + Max[themode]) / 2, (modedepth * ymin)), ((Min[themode] + Max[themode]) / 2, ((1 / 2 * modedepth) * ymin))) → modelabelVector((themean, (sddepth * ymin)), (themean - thesd, (sddepth * ymin))) → sdleftVector((themean, (sddepth * ymin)), (themean + thesd, (sddepth * ymin))) → sdright