
Meaning of Confidence Interval
Loading the math board and drawing, please wait…
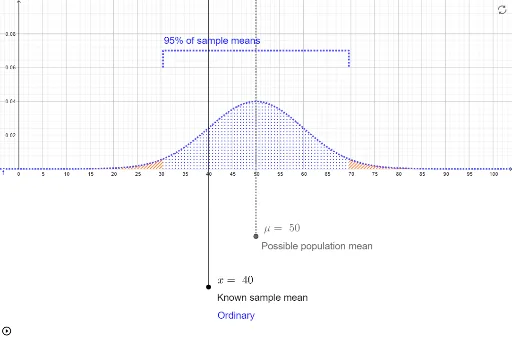
This example demonstrates how to visualize and interpret the concept of a confidence interval using GeoGebra. It involves core mathematical concepts like confidence intervals, normal distributions, sample means, and integral calculations. Key GeoGebra commands and objects used in the construction include Point, Normal, Ray, Integral, and PolyLine, such as plotting normal distribution curves, integral regions, and sample mean lines. It is suitable for high school and above students learning statistical inference and confidence intervals.
GeoGebra Commands & Parameters
Point(Segment[(0, (meandepth * ymin)), (100, (meandepth * ymin))]) → MeanposNormal(themean, thesd, x, false) → fRay(Meanpos, u) → meanlineIntegral(f, cileft, ciright) → inzoneRay(Samplemeanpos, u) → samplemeanlinePolyLine({(cileft, (labelheight95 * ymax)), (cileft, ((labelheight95 + labelwidth) * ymax)), (ciright, ((labelheight95 + labelwidth) * ymax)), (ciright, (labelheight95 * ymax))}) → thelabel95
AI Drawing Prompt Reference
Draw a statistical graph illustrating the concept of a confidence interval. Start with a horizontal baseline, then plot a smooth bell-shaped normal distribution curve above it, symmetric about its mean. Shade the area under the curve between the left and right endpoints of the confidence interval to represent the probability mass. Draw a vertical dashed line at the population mean, and another vertical dashed line at a sample mean position. Above the shaded region, create a rectangular label box with its left and right sides aligned to the confidence interval endpoints, and include the text '95%' inside. The graph should clearly show the normal curve, the shaded interval, the mean lines, and the label box.
The prompt above was compiled from the original drawing commands and is for reference only.