
Binomial Distribution Demo
Loading the math board and drawing, please wait…
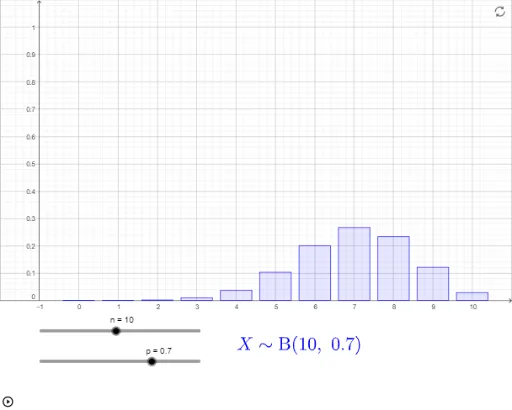
This example demonstrates the probability mass function of a binomial distribution and its variation patterns. Key math concepts include probability & statistics, binomial distribution, function graphing, and integral calculus. GeoGebra commands used are Sequence and BarChart, with objects like n (trials), p (success probability), thexs (x-axis data), thefreqs (frequency data), thedist (distribution object), ymax (max value), ymin (min value), xmax (max x-value), text1 (text annotation), and xmin. Suitable for high school and above students to learn and understand the properties of binomial distribution, or for teaching demonstrations.
GeoGebra Commands & Parameters
Sequence(0, n) → thexsSequence(BinomialDist[n, p, k, false], k, 0, n) → thefreqsBarChart(thexs, thefreqs, 0.8) → thedist
AI Drawing Prompt Reference
Create a bar chart illustrating the probability mass function of a binomial distribution. The x-axis represents the number of successes from 0 to a specified total number of trials, and the y-axis shows the corresponding probabilities. Compute the probability for each possible success count using the given number of trials and success probability, then display these probabilities as equally spaced bars. Include a text annotation showing the current parameter values, and set appropriate axis limits so the entire distribution is clearly visible.
The prompt above was compiled from the original drawing commands and is for reference only.