
Binomial Distribution 1000 Trials Bellcurve
Loading the math board and drawing, please wait…
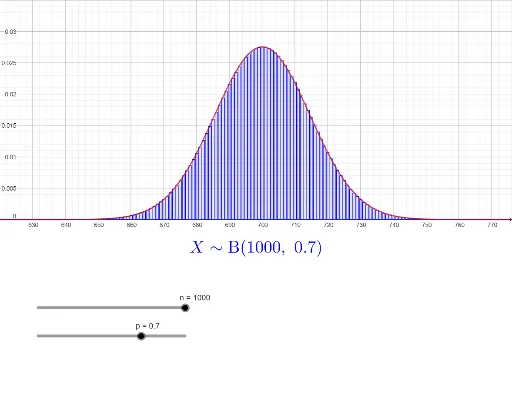
This example demonstrates the binomial distribution results approaching a normal distribution with 1000 trials. Key mathematical concepts include binomial distribution and normal distribution. Using GeoGebra commands Sequence, BarChart, and Normal, users can dynamically adjust the number of trials and success probability to observe distribution changes. Suitable for high school math education and probability statistics learning.
GeoGebra Commands & Parameters
Sequence(0, n) → thexsSequence(BinomialDist[n, p, k, false], k, 0, n) → thefreqsBarChart(thexs, thefreqs, 0.8) → thedistNormal(700, sqrt(((1000 * 0.7) * 0.3)), x, false) → f
AI Drawing Prompt Reference
Create a bar chart showing the binomial distribution results of 1000 trials with a success probability of 0.7, and overlay a normal distribution curve. Adjust the success probability and number of trials to observe changes in the distribution.
The prompt above was compiled from the original drawing commands and is for reference only.