
Taylor Series Visualization for 1/(1-x) and Partial-Sum Approximation
Loading the math board and drawing, please wait…
In collections
Taylor and Maclaurin Series
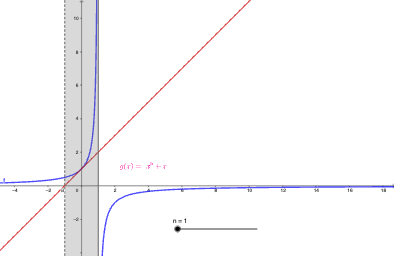
This example visualizes how the function f(x)=1/(1-x) is approximated by Taylor (power) series partial sums of different orders, showing the convergence behavior within the radius of convergence and the truncation error when the series is cut off. The main mathematical ideas are Taylor/power series expansion, the geometric-series structure of 1/(1-x), and the concept of partial sums approaching the original function. In GeoGebra, the construction centers on the command “Sum” to compute the first n terms of the series and build a polynomial approximation for comparison. The involved objects “f, n, g, a, text2” correspond to the target function, the adjustable order parameter n, auxiliary expression(s) for the series approximation, the variable or evaluation point a, and text labeling (e.g., displaying formulas/parameters via text2). Suitable for high-school advanced study through calculus or mathematical analysis instruction, and for learning function approximation via series.
GeoGebra Commands & Parameters
Sum(Sequence[x^(i), i, 0, n, 1]) → g
AI Drawing Prompt Reference
Plot the curve of the function f(x)=1/(1-x) and, in the same coordinate plane, overlay polynomial approximations formed by the Taylor (power) series partial sums. Introduce a truncation order parameter n and construct g as the sum of the first n terms of the power/ geometric-series expansion. Draw f together with g (for different n values if available) to visually compare how the partial sums approach the original function within the radius of convergence (|x|<1), and highlight how truncation creates visible deviation and approximation error when the series is cut off. Include labels to display the series form and the parameter n.
The prompt above was compiled from the original drawing commands and is for reference only.