
Series-Based Construction of Bessel Functions
Loading the math board and drawing, please wait…
In collections
Taylor and Maclaurin Series
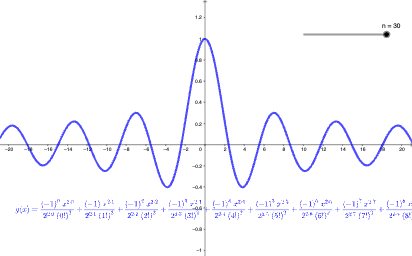
This example demonstrates how a Bessel function can be constructed numerically and visualized by using a series (summation) representation, highlighting its characteristic oscillatory behavior. The key mathematical ideas include Bessel functions, expressing special functions via infinite (or truncated) sums, and studying how parameters influence the resulting function values and graph shape. From the construction summary, the GeoGebra setup centers on the command Sum, summing over an index n to compute the desired expression from the involved objects (such as g and text2). The computed values are then used to produce the function graph so learners can observe the pattern and convergence behavior visually. Suitable for high-school advanced topics through early undergraduate learning, especially for lessons on series, functions, and graphing techniques.
GeoGebra Commands & Parameters
Sum(Sequence[(((-1)^(i) * x^((2 * i)))) / ((2^((2 * i)) * (i!)^(2))), i, 0, n, 1]) → g
AI Drawing Prompt Reference
Draw a function graph in a single coordinate plane where the function value is built from a truncated series. Define the summand as ((-1)^i * x^(2*i)) / (2^(2*i) * (i!)^2), then compute g(x) by summing the terms from i = 0 to a chosen integer upper limit n with step 1. Use this g(x) to plot the curve over a suitable x-range, so the oscillatory behavior and how it changes with the parameter n can be visually examined.
The prompt above was compiled from the original drawing commands and is for reference only.