
Polar Conic Sections
Loading the math board and drawing, please wait…
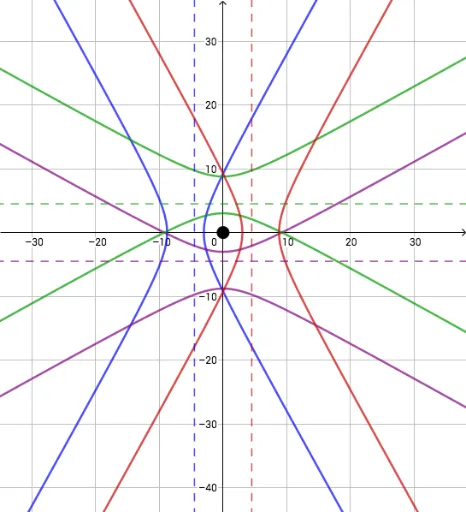
This example demonstrates conic sections in polar coordinates. It involves the basic properties and parametric equations of conic sections. Using GeoGebra commands such as CurveCartesian, Tangent, and Intersect, the generation process of conic sections can be dynamically shown. Suitable for high school mathematics education and learning.
GeoGebra Commands & Parameters
CurveCartesian((g(t) * cos(t)), (g(t) * sin(t)), t, 0, (2 * π)) → bCurveCartesian((h(t) * cos(t)), (h(t) * sin(t)), t, 0, (2 * π)) → cCurveCartesian((p(t) * cos(t)), (p(t) * sin(t)), t, 0, (2 * π)) → iCurveCartesian((f(t) * cos(t)), (f(t) * sin(t)), t, 0, (2 * π)) → aPoint(a) → ATangent(A, a) → jLaTeX("\textcolor{#009900}{r(\theta)=\frac{ed}{1+e\sin(\theta)}}") → text4LaTeX("\textcolor{#CC0000}{r(\theta)=\frac{ed}{1+e\cos(\theta)}}") → text1LaTeX("\textcolor{#0000FF}{r(\theta)=\frac{ed}{1-e\cos(\theta)}}") → text2LaTeX("\textcolor{#800080}{r(\theta)=\frac{ed}{1-e\sin(\theta)}}") → text3Intersect(xAxis, yAxis) → B
AI Drawing Prompt Reference
Draw conic sections in polar coordinates, showing four different forms of polar equations including sine and cosine. First, plot four parametric curves representing conic sections with different eccentricities, then mark a point on each curve and draw the tangent line at that point. Finally, mark the intersection point of the coordinate axes and label the equations in different colors.
The prompt above was compiled from the original drawing commands and is for reference only.