
Cross-sections of a Cylinder and a Cone (Hyperboloid): Constructing Intersection
Loading the math board and drawing, please wait…
In collections
intersection: surface-surface, curve-curve
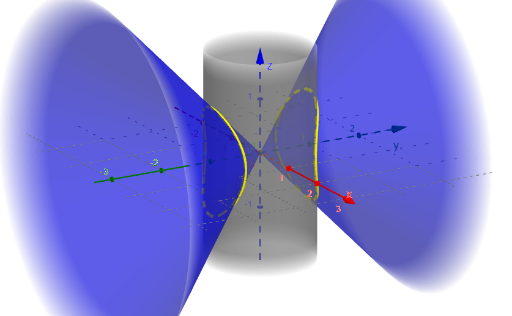
This example demonstrates how to visualize the intersection or cross-section curves arising from a cylinder, a cone, and a hyperboloid-type surface. By varying a parameter, it shows how the resulting curves trace different shapes and how their geometric behavior can be studied. The key mathematics includes solid geometry cross-sections, analytic/coordinate geometry of conic-type intersection curves, parametric modeling, and continuity considerations. Construction-wise, it is built in GeoGebra using the command CurveCartesian to define Cartesian-coordinate curves; it relies on objects such as c_Z, zyl, c_K, hyppol, and the parameter t, together with several constructed curves (kurv_1, kurv_2, kurv_4, etc.) and reference points like P_1, P_2, kurv_3, and a to display the cross-section/intersection geometry clearly. Suitable for high-school to early undergraduate learners, especially for instruction and exploration of 3D analytic geometry and intersections of curved surfaces.
GeoGebra Commands & Parameters
CurveCartesian(t, sqrt(c_Z^(2) - t^(2)), sqrt(c_Z^(2) + c_K^(2) - (2 * t^(2))), t, (-Min[c_Z, sqrt((c_Z^(2) + c_K^(2)) / 2)]), Min[c_Z, sqrt((c_Z^(2) + c_K^(2)) / 2)]) → kurv_1CurveCartesian(t, (-sqrt(c_Z^(2) - t^(2))), (-sqrt(c_Z^(2) + c_K^(2) - (2 * t^(2)))), t, (-Min[c_Z, sqrt((c_Z^(2) + c_K^(2)) / 2)]), Min[c_Z, sqrt((c_Z^(2) + c_K^(2)) / 2)]) → kurv_4CurveCartesian(t, sqrt(c_Z^(2) - t^(2)), (-sqrt(c_Z^(2) + c_K^(2) - (2 * t^(2)))), t, (-Min[c_Z, sqrt((c_Z^(2) + c_K^(2)) / 2)]), Min[c_Z, sqrt((c_Z^(2) + c_K^(2)) / 2)]) → kurv_2CurveCartesian(t, (-sqrt(c_Z^(2) - t^(2))), sqrt(c_Z^(2) + c_K^(2) - (2 * t^(2))), t, (-Min[c_Z, sqrt((c_Z^(2) + c_K^(2)) / 2)]), Min[c_Z, sqrt((c_Z^(2) + c_K^(2)) / 2)]) → kurv_3
AI Drawing Prompt Reference
Draw a three-dimensional graph formed by the intersection of a cylinder, a cone, and a hyperboloid. The graph should include curves such as the cross-section of the cylinder, the lateral curve of the cone, and the intersection lines of the hyperboloid. By varying a parameter, observe how these curves change and form different shapes. The graph should clearly show the intersection points and connections between these geometric objects, suitable for exploring three-dimensional geometry and intersections of curved surfaces.
The prompt above was compiled from the original drawing commands and is for reference only.