
Estimating Rate of Change: Geometric Intuition of Derivatives
Loading the math board and drawing, please wait…
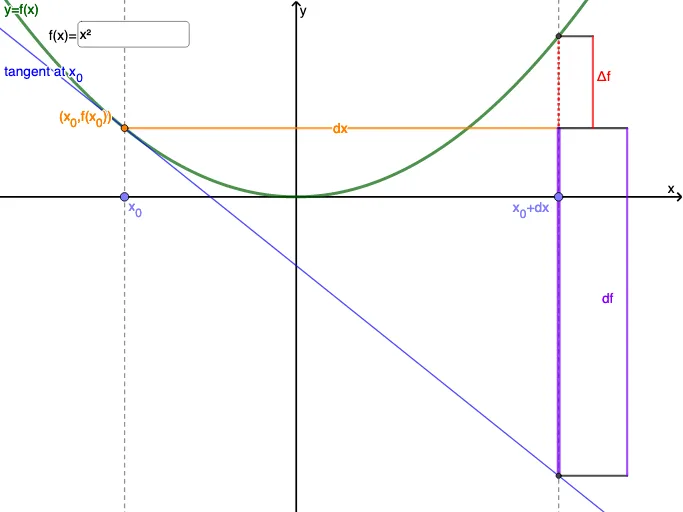
This example demonstrates how to estimate the rate of change of a function using tangent lines through dynamic geometry. ①What it shows: Based on an adjustable function graph, it illustrates the process of secants approaching tangents, presenting the geometric meaning of derivatives; ②Core math concepts: derivative definition, rate of change, tangent slope, limit concept; ③Construction: Uses Point command to create movable points A and B, Tangent for tangent lines, Line for secants, Intersect to find intersections, Segment to measure lengths, Distance to calculate distances, If for conditional logic, Midpoint to find midpoints, InputBox1 for parameter input; ④Suitable for high school or early college calculus introduction,可以作为导数概念教学的可视化辅助工具。
GeoGebra Commands & Parameters
Point(xAxis) → APoint(xAxis) → BTangent(C, f) → iLine(A, C) → gLine(B, D) → hIntersect(i, h) → ETextfield(f) → InputBox1Segment(C, F) → jSegment(D, F) → kSegment(E, F) → lDistance(Corner[1], Corner[2]) → wwIf(k < l, D + (ww / 20, 0), D + (ww / 10, 0)) → GIf(k < l, E + (ww / 10, 0), E + (ww / 20, 0)) → ISegment(F, H) → mSegment(E, I) → nSegment(D, G) → pMidpoint(m) → KIf(k > l, Segment[K, I], Segment[H, I]) → qIf(k < l, Segment[K, G], Segment[H, G]) → r
AI Drawing Prompt Reference
Draw a graph of an adjustable function and illustrate how to estimate the rate of change using dynamic geometry. Include two movable points on the x-axis, a tangent line to the function, and secant lines through the two points. Show the secants approaching the tangent as they move, visually demonstrating the geometric meaning of derivatives. Measure and compare the midpoints of the secants, then dynamically adjust the positions of the midpoints based on the comparison, forming two changing line segments to visualize the derivative definition and limit concept.
The prompt above was compiled from the original drawing commands and is for reference only.