
Parametric Equation and Graphing of a Hyperbola
Loading the math board and drawing, please wait…
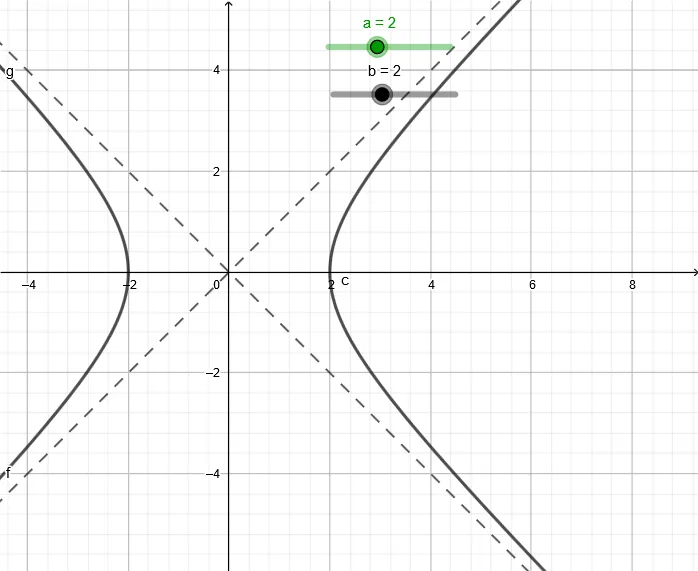
This example demonstrates the analytic representation of a hyperbola by graphing its parametric equation. Key mathematical concepts include the standard hyperbola equation, conversion between parametric and Cartesian forms, and analysis of asymptotes and tangents. Construction highlights: Using GeoGebra's CurveCartesian command to create the hyperbola as a parametric curve, with variables a and b controlling focal distance and shape parameters, while displaying related geometric elements such as foci, directrices, and line segments. Suitable for high school and early college students studying coordinate geometry and pre-calculus, serving as an introductory example for understanding parametric representations of conic sections.
GeoGebra Commands & Parameters
CurveCartesian((a / cos(t), (b * tan(t))), t, 0, (2 * π)) → cCurveCartesian(x(S) + a / cos(t), y(S) + (b * tan(t)), t, 0, (2 * π)) → h2
AI Drawing Prompt Reference
Draw the parametric equation of a hyperbola, where a and b control the focus distance and shape. First, draw the parametric curve of the standard hyperbola, then draw the hyperbola passing through point S, and display the foci, asymptotes, and line segments.
The prompt above was compiled from the original drawing commands and is for reference only.