
Numerical Integration for Free Fall
Loading the math board and drawing, please wait…
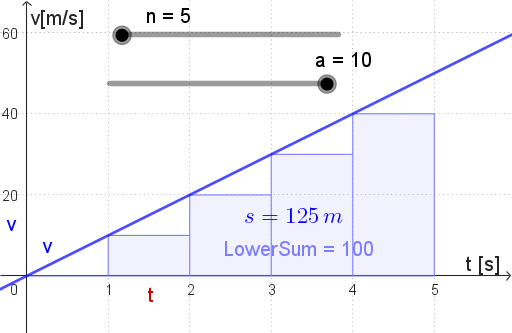
This example demonstrates free-fall motion under constant gravitational acceleration by visualizing how velocity and displacement evolve over time. It emphasizes the accumulation idea behind integration: displacement is obtained as the integral (numerically approximated by sums) of velocity over time. The key math concepts include discretization with a time step, piecewise summation, and the Riemann-sum viewpoint using LowerSum to approximate an integral. Construction uses GeoGebra commands LowerSum and Sequence to generate the time partition and sample values; objects such as a, v, and s represent acceleration, velocity, and displacement (or their corresponding functions/series). Variables like n and l1 support the interval sizing, while B2–B10 and B1 store boundary/segment-related values and A1–A10 hold computed sub-interval points/results. Text labels (text1) help explain the current approximation. Suitable for late high school through early university calculus and modeling lessons, especially for introducing numerical integration and connecting calculus to physical motion.
GeoGebra Commands & Parameters
LowerSum(v, 0, 5, n) → LowerSumSequence((a * t), t, 0, 5, 5 / n) → l1, {0, 10, 20, 30, 40, 50}
AI Drawing Prompt Reference
Create a graph illustrating free-fall motion by visualizing velocity and displacement over time, emphasizing the accumulation concept of integration. Include a curve representing velocity versus time and a displacement curve obtained through numerical integration (approximated by left Riemann sums). Use colored points or segments to indicate time partitions, and draw velocity rectangles within each subinterval to show the summation process of the left Riemann sum. Add text annotations to explain the current approximation and the interval details.
The prompt above was compiled from the original drawing commands and is for reference only.