
Maximizing Product with a Given Sum
Loading the math board and drawing, please wait…
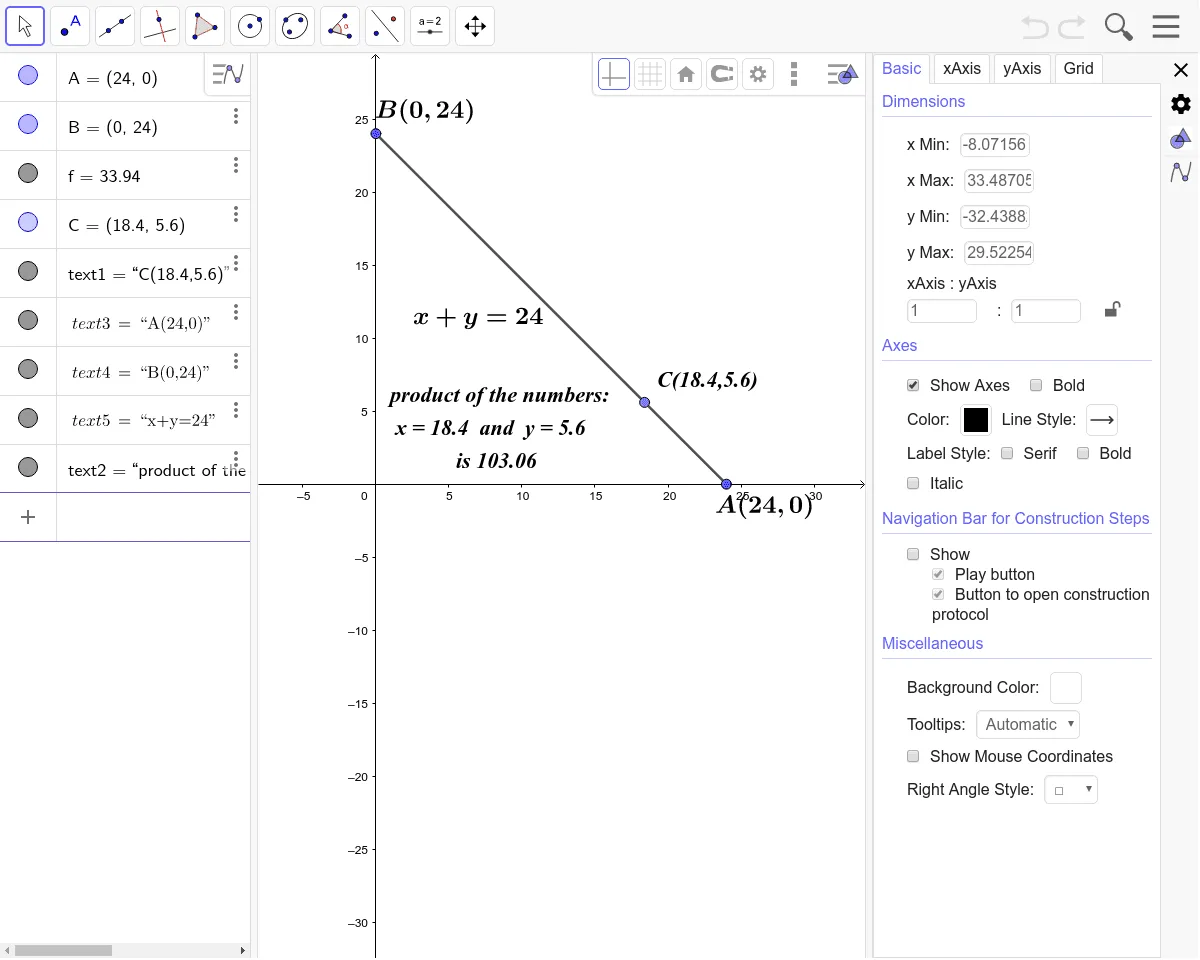
This GeoGebra example demonstrates, visually, how the product of quantities reaches its maximum under a fixed-sum constraint. The key ideas are optimization: finding the maximum of a product subject to a condition. It links the maximum-product behavior to function relationships and can be interpreted using calculus notions such as extreme points (e.g., via derivative-based reasoning or slope/graph-change intuition). Construction-wise, the example uses Segment and Point commands to build the geometric setup (the constraint representation and the variable-dependent configuration). It also uses Text to label important components and results. The objects A, B serve as endpoints/variable carriers under the sum condition, C acts as a key reference/candidate location where the optimum occurs, and f represents the underlying functional relationship used for the visualization. Text objects (text1–text5) annotate the derivation, constraints, or the maximum-product outcome. Suitable for advanced high school through early university courses, especially for lessons on optimization and using graphs to understand maxima.
GeoGebra Commands & Parameters
Segment(A, B) → fPoint(f) → CText((((("C(" * x(C)) * ",") * y(C)) * ")")) → text1Text(((((("product of the numbers: \\n x = " * x(C)) * " and y = ") * y(C)) * " \\n is ") * Product[{x(C), y(C)}])) → text2
AI Drawing Prompt Reference
Draw a line segment AB, then place a point C on it to represent the sum of two numbers x and y as a constant. Calculate the values of x and y based on the coordinates of point C, and then calculate their product, displaying the product value on the graph.
The prompt above was compiled from the original drawing commands and is for reference only.