
Rate of Change of Area
Loading the math board and drawing, please wait…
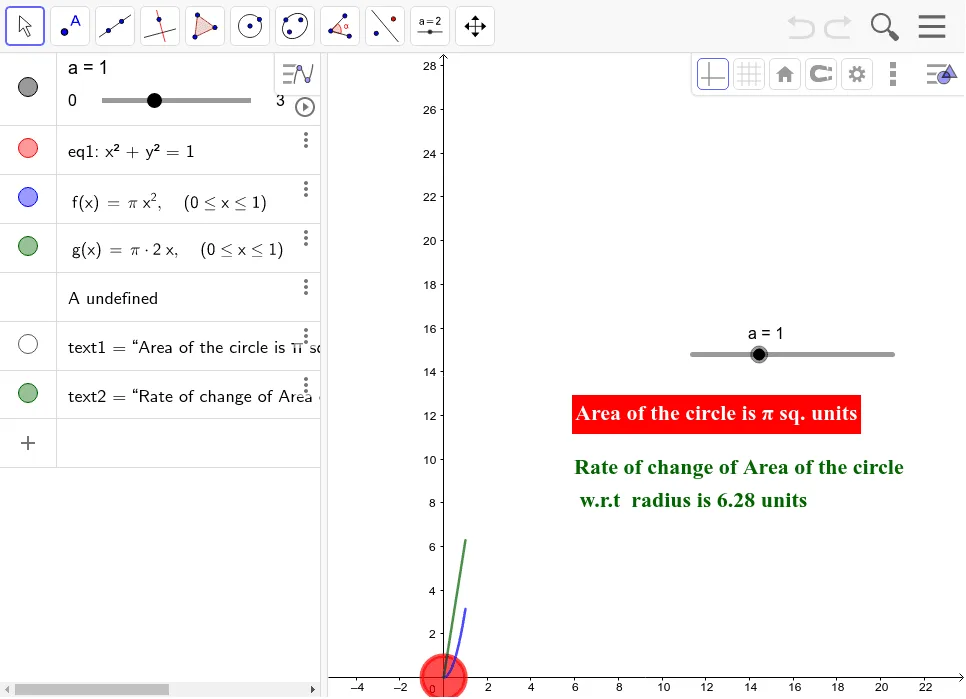
This example demonstrates the rate of change of area. Using the concept of derivatives in calculus, it studies the instantaneous rate of change of area with respect to a variable. The construction involves the use of Intersect and Text commands, and covers key concepts such as area and derivatives. Suitable for high school mathematics education and students learning calculus.
GeoGebra Commands & Parameters
Intersect(f, g, (2.00000000370819, 12.566370660957665)) → AText((("Area of the circle is " * f(a)) * " sq. units")) → text1Text((("Rate of change of Area of the circle\\n w.r.t radius is " * g(a)) * " units")) → text2
AI Drawing Prompt Reference
Create a diagram illustrating the rate of change of area for a circle. Define a radius variable and use a function f to represent the circle’s area, and a function g to represent the derivative (instantaneous rate of change of area with respect to radius). Choose a specific radius value around 2, then mark the intersection point of the two corresponding curves/graph relationships at that value, labeling it A. Add two text annotations: one stating “Area of the circle is f(a) sq. units” and another stating “Rate of change of Area of the circle w.r.t radius is g(a) units,” both referring to the same radius a.
The prompt above was compiled from the original drawing commands and is for reference only.