
Exponential–Logarithm Pairing: Graphs, Tangents, and Construction
Loading the math board and drawing, please wait…
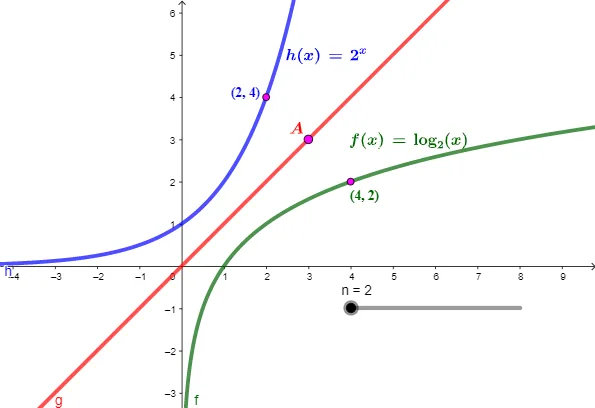
This GeoGebra example demonstrates the relationship between exponential and logarithmic functions by constructing their graphs in a shared coordinate setting and highlighting how their curve behavior connects through geometric correspondences. It focuses on key concepts such as exponential and logarithmic function properties, interpreting graph shapes, understanding tangents as a local description of change, and using coordinate-based construction ideas (including mirror/symmetry) to relate the two function families. The construction uses GeoGebra commands including Point (defining key points), OrthogonalLine (building perpendicular structures), Intersect (finding intersection points), Text and LaTeX (adding explanatory labels and mathematical notation), and Mirror (applying reflection/symmetry to obtain corresponding elements). Relevant objects include several function/parameter entities (e.g., g, n, f, h) and auxiliary labeled points (A, B, C, D, D′, etc.) that support the tangent and correspondence visualization. Suitable for middle/high school function units, graph interpretation practice, and interactive classroom demonstrations.
GeoGebra Commands & Parameters
Point(g) → AOrthogonalLine(A, g) → iIntersect(f, i, (4, 2)) → BIntersect(h, i, (1.999999999999033, 3.999999999997319)) → CText((((("(" * x(B)) * ", ") * y(B)) * ")")) → text1Text((((("(" * x(C)) * ", ") * y(C)) * ")")) → text2Point(f) → DMirror(D, g) → D'LaTeX(h, true, true) → text4LaTeX(f, true, true) → text3
AI Drawing Prompt Reference
Draw a coordinate plane with an exponential curve and a logarithmic curve that are mirror images across a diagonal line. Pick a point on the exponential curve and draw a perpendicular line from it to the diagonal line; this perpendicular intersects both curves at two points, and label those intersection points with their coordinates. Then choose another point on the exponential curve and reflect it across the diagonal line to show its mirrored counterpart. Finally, display the equations of both curves as mathematical formulas near them, and include coordinate labels for the key points. The overall picture highlights the symmetry and geometric connection between the two function families.
The prompt above was compiled from the original drawing commands and is for reference only.