
“Growing and Growing” with Power Functions
Loading the math board and drawing, please wait…
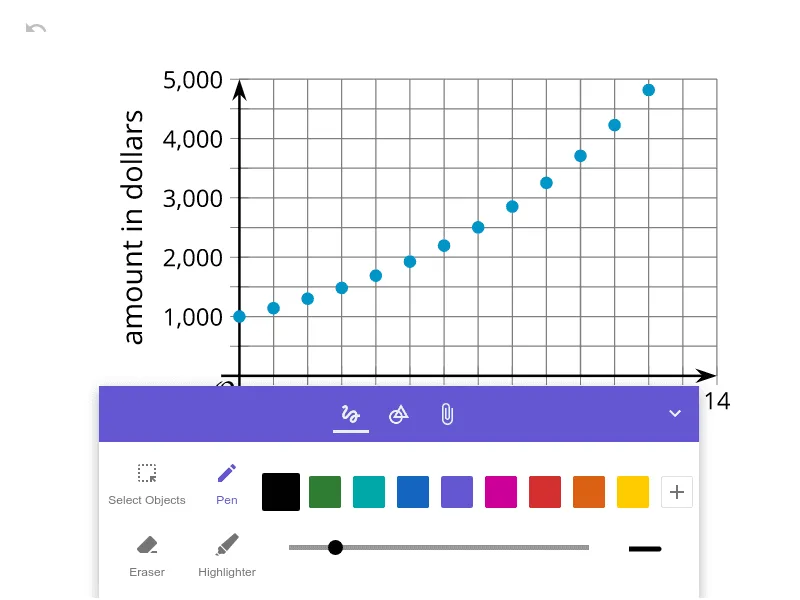
This GeoGebra example demonstrates the “growing and growing” behavior of power functions across scales, using similarity (similarity transformations) to link corresponding quantities. It emphasizes key ideas: power functions and their growth patterns, similarity transformation/similarity for invariant relationships, geometric mean as a geometric-to-algebraic bridge, and differential calculus (derivative intuition) to interpret how growth rate changes. Construction is likely centered on graphing power functions (function/graphing objects), applying geometric similarity or related transformations to form corresponding figures (transformation/similarity objects), and encoding geometric quantities such as geometric mean and subtraction via segment lengths or coordinate-based expressions. Suitable for high school advanced coursework and early college learners studying function behavior, geometric similarity, and derivative-based understanding of increasing trends.
AI Drawing Prompt Reference
In the same coordinate plane, draw and compare several power-function graphs to emphasize the “growing and growing” behavior across scales. Construct a geometric similarity relationship that links corresponding quantities at different magnitudes, showing an invariant correspondence via similarity transformations. Use segment lengths or coordinate-based expressions to present the geometric mean as a bridge between geometric quantities and algebraic relations. Include an element that supports derivative intuition for how the growth rate changes (for instance, a local/tangent-style depiction tied to slope changing with the input). Keep the power curves, the similarity structure, the geometric mean, and the local growth interpretation all in one coherent figure.
The prompt above was compiled from the original drawing commands and is for reference only.