
Visualizing Polynomial Roots with Extrema and Turning Points
Loading the math board and drawing, please wait…
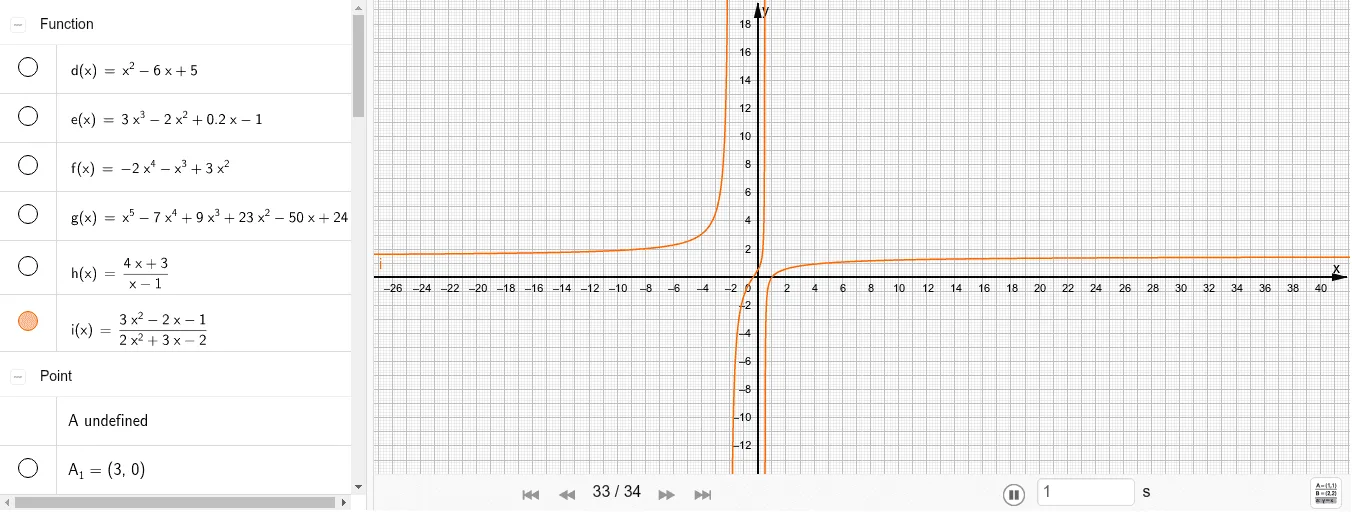
This example demonstrates how to link a polynomial assignment with its computed roots and key shape-defining points (extrema and turning points) in one interactive graphing environment. It focuses on the geometric meaning of polynomial zeros and how they relate to the curve’s behavior. The core concepts are: polynomial roots (solutions where the function equals zero), extrema (local maxima/minima), and turning points (points where the curve changes its monotonicity/curvature trend). Construction-wise, it uses GeoGebra commands Root to compute and display the roots of the relevant functions, Extremum to locate and mark extrema, and TurningPoint to identify turning points on the polynomial curves. Multiple function objects (e.g., f, g, h) and many derived point/curve objects (e.g., A, B, C, …, plus indexed variants like A_1, B_1, …) are used to build and relate the curves and their critical points, producing a clear visualization of how algebraic solutions correspond to visible features of the graphs. Suitable for high school to early undergraduate teaching, especially for function graph analysis and intuitive groundwork before formal calculus topics.
GeoGebra Commands & Parameters
Root(h) → A, B, CExtremum(h) → D, ETurningPoint(h) → FRoot(d) → G, HExtremum(d) → ITurningPoint(d) → JRoot(e) → KExtremum(e) → L, MTurningPoint(e) → NRoot(f) → O, P, QExtremum(f) → R, S, TTurningPoint(f) → U, VRoot(g) → W, Z, A_1, B_1Extremum(g) → C_1, D_1, E_1, F_1TurningPoint(g) → G_1, H_1, I_1Roots(h) → J_1Extremum(h) → K_1,TurningPoint(h) → L_1Roots(i) → M_1, N_1Extremum(i) → O_1, ,TurningPoint(i) → P_1
AI Drawing Prompt Reference
In one coordinate plane, draw several polynomial graphs and, for each graph, mark the key geometric points: the roots where the function equals zero, the extrema (local maxima/minima), and the turning points where the curve changes its shape behavior. For each selected polynomial, first locate and display its root points, then determine and mark its extrema on the same curve, and finally identify and mark its turning point(s). Repeat this process across multiple polynomial functions so that the roots, extrema, and turning points are clearly visible and correspond to their respective curves.
The prompt above was compiled from the original drawing commands and is for reference only.