
Loci on Complex Plane - Arguments
Loading the math board and drawing, please wait…
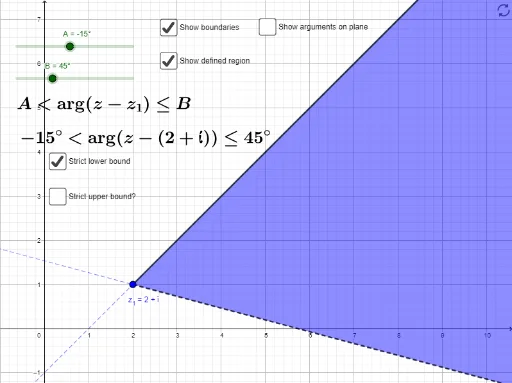
This example demonstrates how to draw loci on the complex plane based on argument conditions. Core math concepts include complex numbers, argument, inequalities, and locus. GeoGebra commands used are Ray, If, and Angle. Suitable for high school and above students to understand complex number geometry and locus plotting.
GeoGebra Commands & Parameters
Ray(z_1, Vector[(cos(A), sin(A))]) → fRay(z_1, Vector[(cos(B), sin(B))]) → gIf(lb, strict, nstrict) → lbtIf(ub, strict, nstrict) → ubtRay(z_1, Vector[(cos(A), sin(A))]) → f_1Ray(z_1, Vector[(cos(B), sin(B))]) → g_1If(B - A < π, If[abs(A) < π / 2, y > f(x), y < f(x)] ∧ If[abs(B) < π / 2, y < g(x), y > g(x)], If[abs(A) < π / 2, y > f(x), y < f(x)] ∨ If[abs(B) < π / 2, y < g(x), y > g(x)]) → aRay(z_1, Vector[(1, 0)]) → hAngle(h, g) → βAngle(h, f_1) → α
AI Drawing Prompt Reference
Draw the locus on the complex plane based on angle conditions. Start by drawing two rays f and g from point z1 with directions cos(A) and cos(B), respectively. Then, based on the ranges of A and B, draw the corresponding inequality regions. Next, draw the real axis ray h and calculate the angles β and α between h and rays f and g.
The prompt above was compiled from the original drawing commands and is for reference only.