
Penguin on Slippery Ice: Friction, Forces, and Center of Mass
Loading the math board and drawing, please wait…
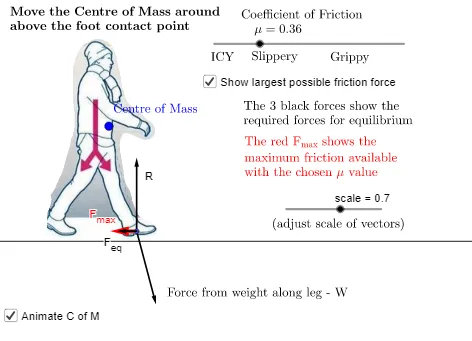
This example uses a “penguin on ice” scenario to demonstrate how friction and the center-of-mass location determine whether the motion remains stable and which directions are physically feasible. It is built around 2D vector geometry to represent forces, trigonometric relationships to encode direction/angle dependencies, and ratio-style comparisons related to friction limits (e.g., effective force versus maximum available friction). Construction is done in GeoGebra by creating key points and geometric references (Point; Line; OrthogonalLine for perpendicular structure; Segment for bounded connections) and then drawing force vectors (Vector) such as effective force and maximum friction capacity. Named objects like the friction coefficient μ, force vectors (F, F_eq, F_max), and center-of-mass-related elements (e.g., cofmoverfoot) connect the physical constraint to a clear geometric visualization. Suitable for high school advanced classes and early undergraduate modeling/physics-math lessons on vectors and trigonometry.
GeoGebra Commands & Parameters
Point(yAxis) → GOrthogonalLine(G, yAxis) → fPoint(f) → IPoint(f) → HSegment(H, I) → gPoint(g) → CVector(C, D) → uVector(D, D + (u * scale)) → WVector(D, D + (((0, 1) * W) * Vector[(0, -1)])) → RVector(D, D - (Vector[(1, 0)] * (W * (1, 0)))) → F_{eq}Vector(D, D + ((UnitVector[F_{eq}] * μ) * abs(R))) → F_{max}Point(xAxis) → FPoint(xAxis) → EPoint(xAxis) → APoint(xAxis) → BPoint(xAxis) → JPoint(xAxis) → KPoint(yAxis) → LPoint(xAxis) → MLine(L, M) → hPoint(h) → NPoint(h) → OSegment(C, D) → i
AI Drawing Prompt Reference
Draw a penguin on slippery ice with arrows indicating the friction force and maximum friction force. Start by creating the penguin's center of mass point C on the y-axis, then create points I and H on the perpendicular line f, and connect H and I to form the perpendicular line f. Next, create the point D where the friction force acts on f, draw the vector u representing the friction coefficient from D, and then draw the vectors F_eq and F_max for the effective and maximum friction forces. Finally, create boundary points F, E, A, B, J, K, L, and M on the x-axis, draw the ice surface line h, and create points N and O on h. Draw a line connecting the center of mass point C and the point D where the friction force acts.
The prompt above was compiled from the original drawing commands and is for reference only.