
Comparing Numerical Integration: Upper/Lower Riemann Sums and Trapezoids
Loading the math board and drawing, please wait…
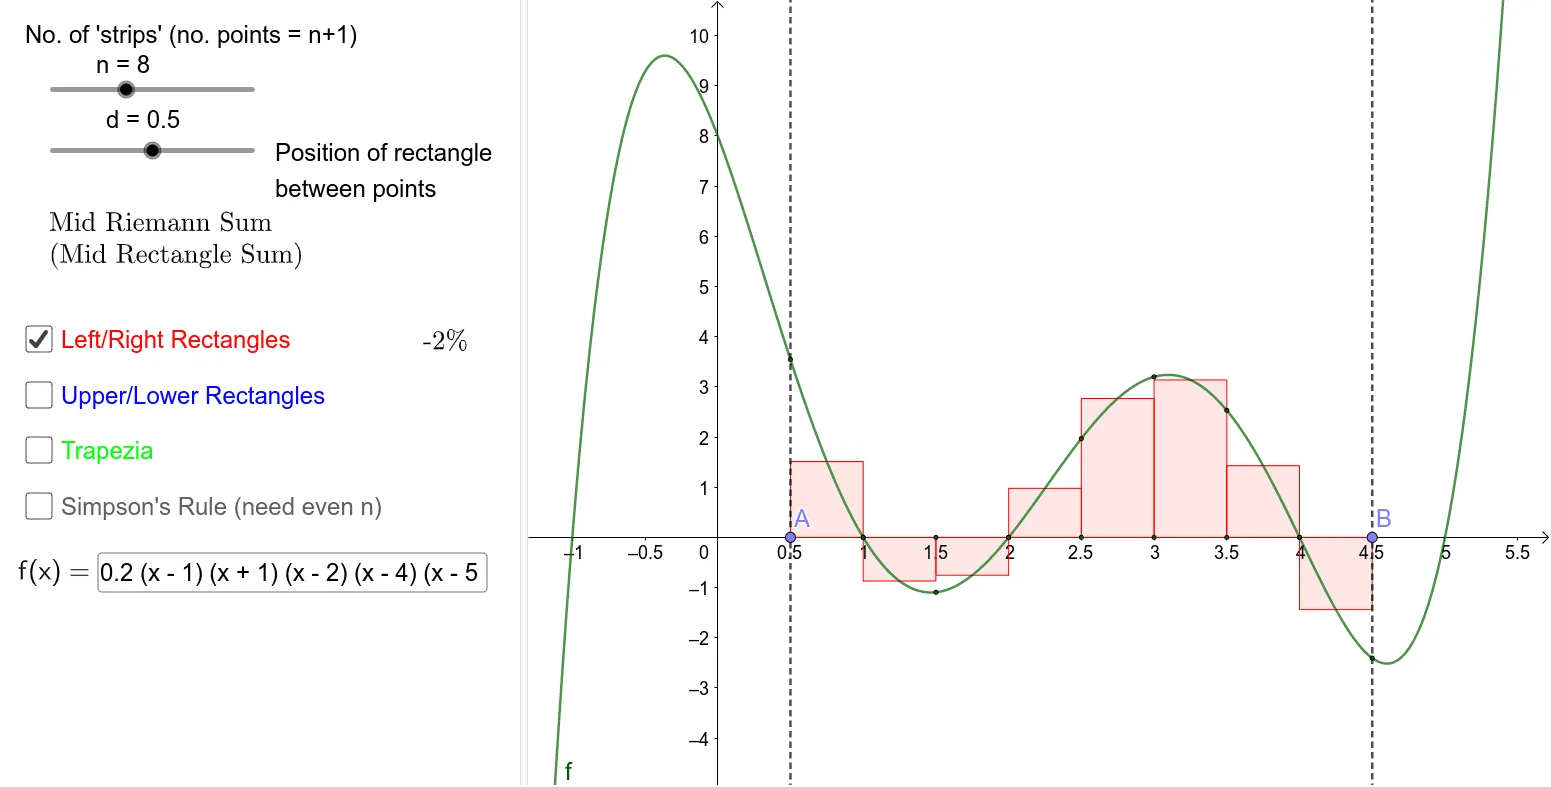
This GeoGebra example visualizes numerical integration by comparing geometric area approximations of a function over [A,B]. It demonstrates how the upper and lower Riemann sums, as well as the trapezoidal sum, approximate the definite integral and how the approximation improves as the number of subintervals increases. The key math concepts include the definite integral, UpperSum and LowerSum (upper/lower Riemann sums), TrapezoidalSum, partitioning the interval, and the role of discretization in numerical accuracy. Construction highlights: Points and RectangleSum are used to build the rectangle-based area visualization; If and Sequence help generate piecewise parameters and summation terms; UpperSum, LowerSum, and TrapezoidalSum produce Upsum, Lowsum, and Trapsum; Sum and Integral enable a direct comparison between the numerical approximations and the exact definite integral. Textfield labels and annotations (e.g., for interval endpoints and mid/left/right information) support clear interpretation. Suitable for high school and early calculus courses, as well as learners studying the geometric meaning of integrals and basic numerical integration methods.
GeoGebra Commands & Parameters
Point(xAxis) → APoint(xAxis) → BRectangleSum(f, x(A), x(B), n, d) → LRsumIf(d ≟ 0, lefttext, If[d ≟ 0.5, midtext, If[d ≟ 1, righttext]]) → text1UpperSum(f, x(A), x(B), n) → UpsumLowerSum(f, x(A), x(B), n) → LowsumTrapezoidalSum(f, x(A), x(B), n) → TrapsumSequence(x(A) + ((x(B) - x(A)) / n * ii), ii, 0, n) → l1Zip((aa, bb), aa, l1, bb, l2) → l3Last(l1, n - 1) → l6Sequence(Sequence[Element[l3, ii], ii, jj, jj + 2], jj, 1, n - 1, 2) → l7Zip(FitPoly[ll, 2], ll, l7) → l4Sequence(Element[l3, ii], ii, 1, n + 1, 2) → oddsSequence(Element[l3, ii], ii, 2, n + 1, 2) → evensLast(odds, Length[odds] - 1) → l8Zip(If[aa ≤ x ≤ bb, gg(x)], gg, l4, aa, x(odds), bb, x(l8)) → l5Zip(Integral[gg, aa, bb], gg, l4, aa, x(odds), bb, x(l8)) → l9Zip((aa, 0), aa, l1) → l10Textfield(f) → InputBox1Integral(f, x(A), x(B)) → pSum(l9) → Simpsum
AI Drawing Prompt Reference
Draw the numerical integration graph of function f over the interval [A, B], including upper, lower Riemann, and trapezoidal approximations. Start by plotting the interval endpoints A and B, then use the RectangleSum function to draw the rectangular area approximation, followed by the UpperSum, LowerSum, and TrapezoidalSum functions to draw the upper, lower Riemann, and trapezoidal approximations, and finally use the Sum function to calculate the difference between the trapezoidal approximation and the exact integral.
The prompt above was compiled from the original drawing commands and is for reference only.