
Anatomy of a Logarithmic Function: Special Points and Riemann-Sum Geometry (Part
Loading the math board and drawing, please wait…
In collections
Graphing Logarithmic Functions
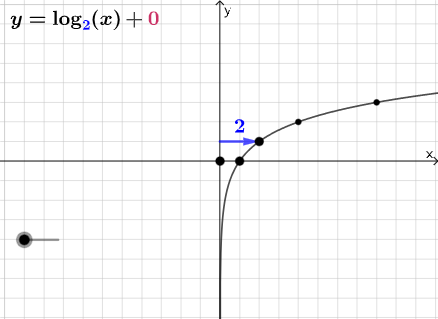
This GeoGebra example visually “dissects” a logarithmic function by highlighting its structural behavior near key points and connecting the idea of accumulated area to upper/lower sums (Riemann sums) and related geometric partitions. The core topics are logarithmic functions and their graphs, special points used to anchor the construction, linear functions as auxiliary references, and the geometric interpretation of upper and lower sums / Riemann sums. Construction is driven by GeoGebra commands such as Point (to place key vertices like interval endpoints and reference markers), Intersect (to compute intersection points that tie auxiliary lines/curves to the log graph), and Vector (to encode directional relationships needed for connecting, partitioning, or measuring geometric quantities). The presence of many labeled intermediate objects and text annotations indicates a step-by-step, concept-first build that makes the relationship between the log curve’s shape and area-sum approximations more tangible. Suitable for high school to early university instruction, especially function graphing and pre-calculus/intro-calculus lessons about area and Riemann sums.
GeoGebra Commands & Parameters
Point(Ray[B + (1, 1), B + (2, 1)]) → CPoint(Ray[B + (1, -1), B + (2, -1)]) → DIntersect(xAxis, yAxis) → GVector(G, A) → uVector(H, B) → vIntersect(eq1, y = y(C)) → IIntersect(eq1, y = y(D)) → JVector(I, C) → wVector(J, D) → j
AI Drawing Prompt Reference
Draw a logarithmic function graph with its special points and Riemann-sum geometry. Start with coordinate axes and mark the origin. Place two reference points on parallel rays above and below the curve to define interval endpoints. Draw vectors from the origin to a key point on the curve and from another reference point to a corresponding point on the curve. Then draw horizontal lines through the reference points to intersect the log curve, creating two intersection points. Finally, draw vectors from these intersections back to the reference points, forming geometric regions that illustrate upper and lower sums for area approximation.
The prompt above was compiled from the original drawing commands and is for reference only.