
Linear Regression Example 3: Least Squares Fit and Geometric Construction
Loading the math board and drawing, please wait…
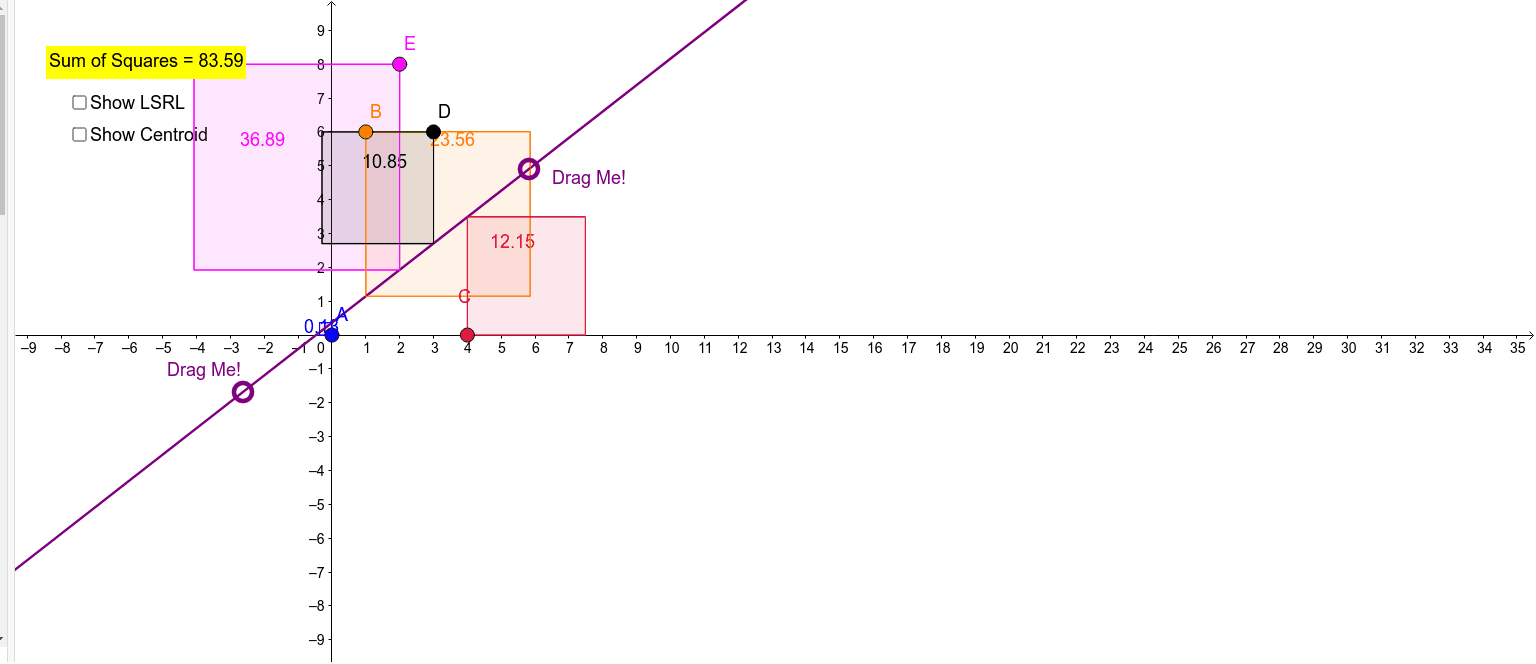
① This example demonstrates how to perform a least-squares linear regression on a set of scattered data points using GeoGebra's FitLineY command, and visualizes the geometric relationship between the fitted line and the data points. ② Core mathematical concepts include linear regression, least squares method, correlation, geometric mean, orthogonal projection of points onto a line, and polygon area calculations (to visualize residual sum of squares). ③ Construction highlights: uses Line, OrthogonalLine, and Intersect commands to construct auxiliary lines and intersection points, Polygon and Sum commands to compute residual-related areas, and finally FitLineY to generate the regression line; objects include multiple points (A to R), lines (a to s), and polygons (poly1 to poly4). ④ Suitable for high school to university-level teaching that integrates statistics and geometry, providing an intuitive understanding of the geometric meaning of regression lines and the least squares principle.
GeoGebra Commands & Parameters
Line(F, H) → aOrthogonalLine(A, xAxis) → bOrthogonalLine(E, xAxis) → cOrthogonalLine(B, xAxis) → dOrthogonalLine(D, xAxis) → eOrthogonalLine(C, xAxis) → fIntersect(b, a) → H_1Intersect(c, a) → IIntersect(d, a) → JIntersect(a, f) → KIntersect(e, a) → LPolygon(A, H_1, 4) → poly1, g, h, i, j, M, NPolygon(I, E, 4) → poly2, k, l, m, n, O, PPolygon(B, J, 4) → poly3, p, q, r, s, Q, RPolygon(L, D, 4) → poly4, t, a_1, b_1, c_1, S, TPolygon(K, C, 4) → poly5, d_1, e_1, f_1, g_1, U, VSum(A1:A5) → A6FitLineY({A, B, C, D, E}) → h_1
AI Drawing Prompt Reference
Draw five scattered points and a best-fit line through them. From each point, drop a perpendicular to the x-axis, then from each foot on the x-axis, draw a perpendicular to the fit line, marking the intersection. Construct rectangles using each point, its foot, and the intersection as vertices; these rectangles visualize residual squares. Finally, show the regression line and the geometric relationship between the points and the line.
The prompt above was compiled from the original drawing commands and is for reference only.