
Linear Fit to Data: Building a Best-Fit Line via Slope
Loading the math board and drawing, please wait…
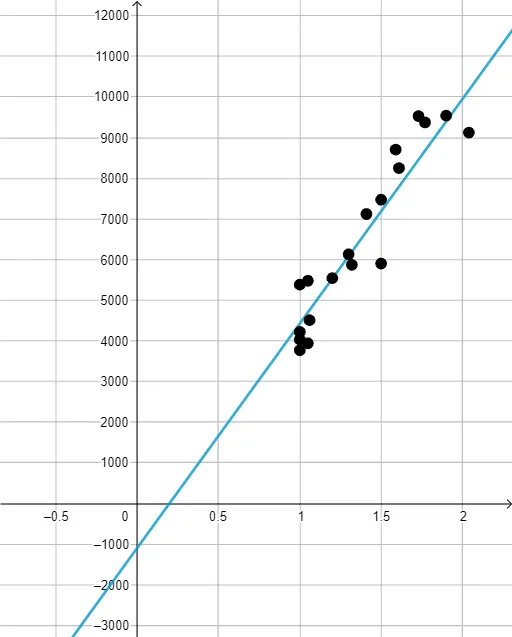
This example demonstrates how to fit a line to a set of data points and interpret the fitting behavior using slope and difference/increment ideas. It centers on the linear function model, the definition of slope, arithmetic relationships between differences (changes), and how a line is determined and visualized from point data. In construction, multiple points (pt1 through pt20) represent the dataset, while the main line/function object f captures the fitted relationship. Additional show1 through show19 objects are used to display intermediate steps and key visual/quantitative comparisons tied to slope and differences during the fitting workflow. Suitable for middle school to high school learners, it works well for lessons on functions and coordinate geometry, and for early-stage data modeling and visualization.
GeoGebra Commands & Parameters
y = (5520 * x) - 1091(1.9, 9541)(2.04, 9125)(1.73, 9530)(1.77, 9374)(1.61, 8252)(1.59, 8706)(1.85, 98169)(1.5, 7474)(1.41, 7122)(1.5, 5904)(1.32, 5872)(1.3, 6131)(1.05, 5480)(1, 5385)(1.2, 5544)(1.06, 4511)(1, 4221)(1, 3772)(1, 4032)(1.05, 3942)Boolean show1(false)Boolean show2(false)Boolean show3(false)Boolean show4(false)Boolean show5(false)Boolean show6(false)Boolean show7(false)Boolean show8(false)Boolean show9(false)Boolean show10(false)Boolean show11(false)Boolean show12(false)Boolean show13(false)Boolean show14(false)Boolean show15(false)Boolean show16(false)Boolean show17(false)Boolean show18(false)Boolean show19(false)Boolean show20(false)Boolean reset(false)
AI Drawing Prompt Reference
Plot a set of data points and draw a best-fit line through them, representing the trend as a function graph. Also, display the vertical distances from each data point to the fitted line, and illustrate the fitting process by calculating these distances. Use distinct colors or styles for the original data points, the fitted line, and the distance lines, and label key values like slope and increments to help understand the linear function model and coordinate geometry relationships.
The prompt above was compiled from the original drawing commands and is for reference only.