
Statistical Analysis with Box Plot and Geometric Elements
Loading the math board and drawing, please wait…
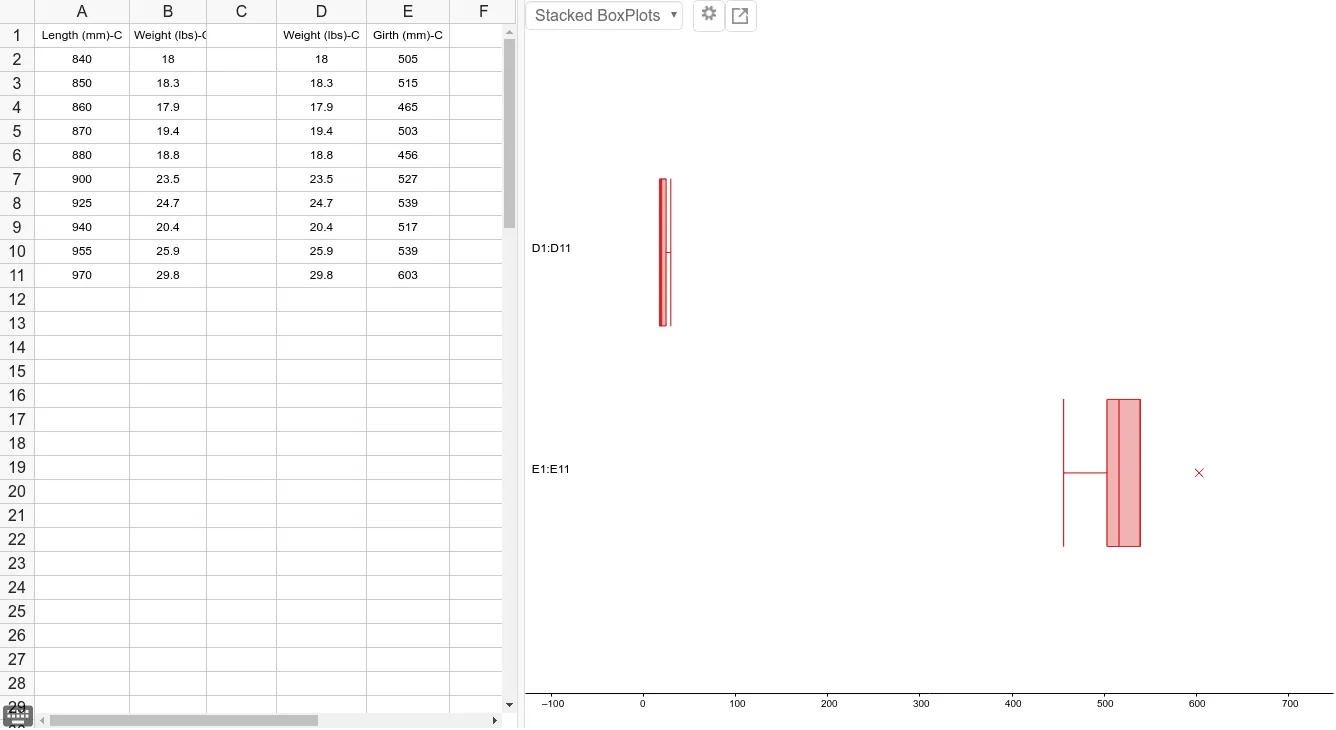
①This GeoGebra example demonstrates a comprehensive statistical analysis scene combining box plots, text annotations, sine curves, secant lines, and centroids, showing how data distribution can be visualized alongside geometric constructs. ②Core mathematical concepts include statistical characteristics (median, quartiles, mean), box plot construction, linear equations and secant line slopes, centroid/barycenter, and sine functions. ③Construction highlights: The BoxPlot command is used to generate box plots, Text command adds labels; objects A1 to B11 and D1 to E9 represent multiple points for data, auxiliary lines, and annotations, likely allowing dynamic updates via sliders or input data. ④Suitable for high school or college statistics courses, this example helps students understand data visualization, distribution shapes, and their interplay with function graphs, and serves as a teaching tool for demonstrating statistical and geometric integration.
GeoGebra Commands & Parameters
BoxPlot(1, 0.3333333333333333, {505, 515, 465, 503, 456, 527, 539, 517, 539, 603}, true) →BoxPlot(2, 0.3333333333333333, {18, 18.3, 17.9, 19.4, 18.8, 23.5, 24.7, 20.4, 25.9, 29.8}, true) →Text(" E1:E11 ", (-128.375, 1)) →Text(" D1:D11 ", (-128.375, 2)) →
AI Drawing Prompt Reference
Create a statistical analysis graph with two box plots and annotations. First, draw two box plots to show the distribution of two sets of data. Then add annotations at appropriate positions to explain the data points and auxiliary lines.
The prompt above was compiled from the original drawing commands and is for reference only.