
Probability Distributions and Normal Tests Interactive Demo
Loading the math board and drawing, please wait…
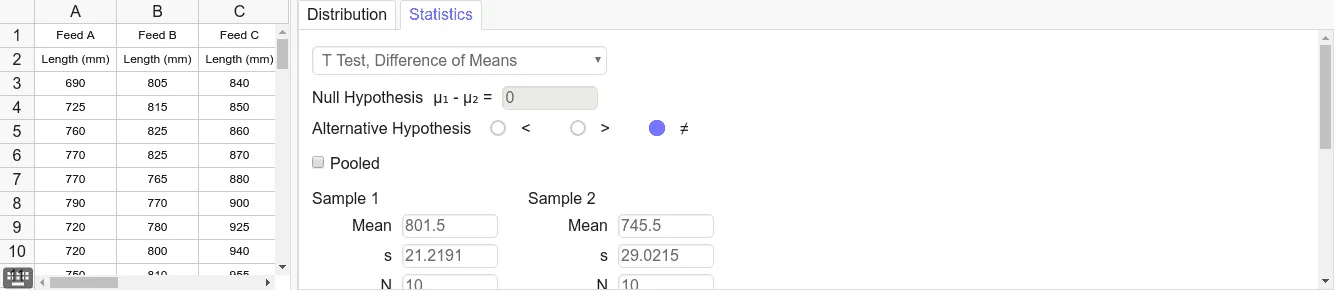
This GeoGebra example visualizes probability distributions, focusing on normal distribution and related statistical tests. It uses a series of point objects (A1 through D10) to mark key positions on the distribution curve, likely allowing dynamic adjustment of parameters to observe changes in probabilities. Core mathematical concepts include probability density functions, normal distribution, sample statistics, and limit concepts. The construction relies on GeoGebra point objects to represent data points or critical values, possibly combined with sliders for interactive exploration. This resource is suitable for high school or university statistics courses, helping students understand properties of normal distributions, probability calculations, and hypothesis testing fundamentals. It serves as an effective classroom demonstration tool or self-paced learning aid.
GeoGebra Commands & Parameters
690805840835725815850850760825860855770825870860770765880875790770900895720780925910720800940930750810955950760820970995