
Limits and Continuity
Loading the math board and drawing, please wait…
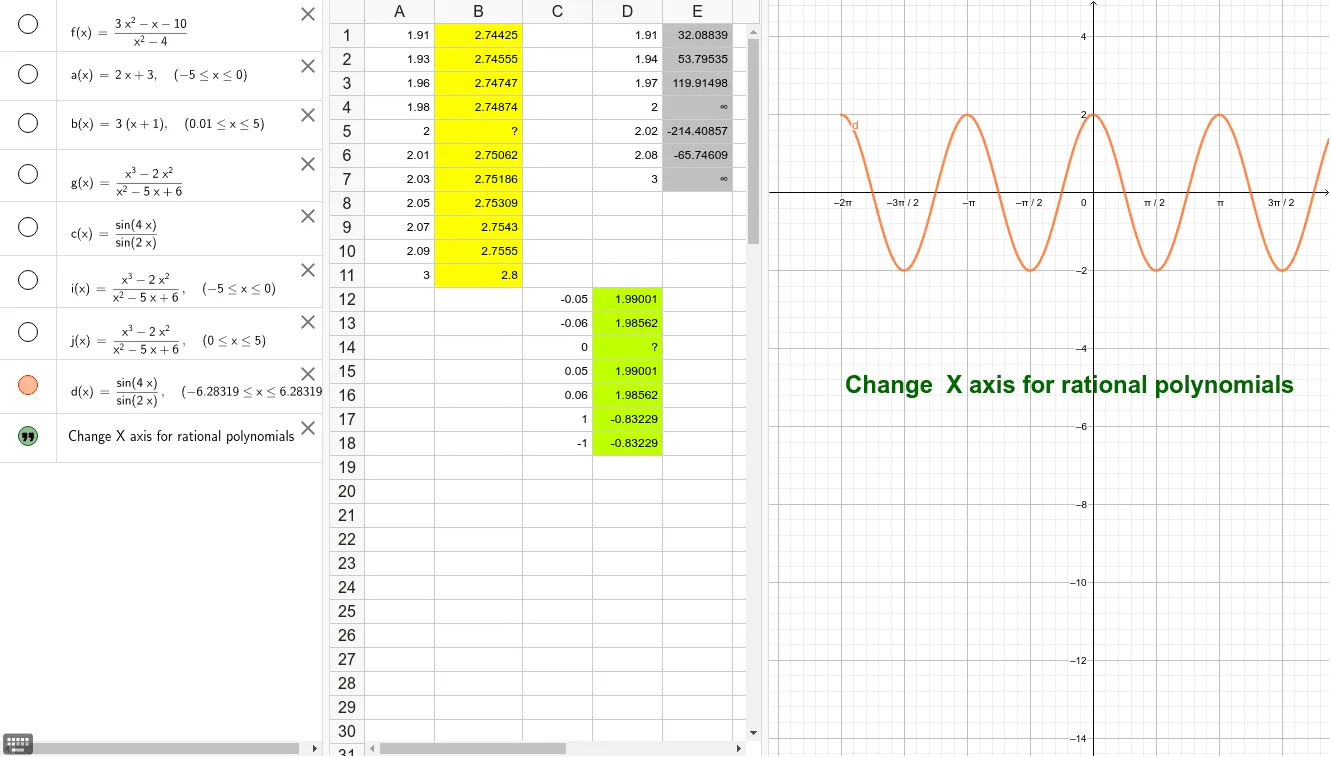
This example illustrates the concepts of limits and continuity. By examining the graph of function f, it shows how the function values change as the independent variable approaches a certain point. Key mathematical concepts include limits and continuity. The construction summary mentions the use of functions and slider animation GeoGebra objects and commands. Suitable for high school mathematics education and learning.
GeoGebra Commands & Parameters
f(x) = ((3 * x^(2)) - x - 10) / (x^(2) - 4)1.911.931.961.9822.012.032.052.072.093((3 * A1^(2)) - A1 - 10) / (A1^(2) - 4)((3 * A2^(2)) - A2 - 10) / (A2^(2) - 4)((3 * A3^(2)) - A3 - 10) / (A3^(2) - 4)((3 * A4^(2)) - A4 - 10) / (A4^(2) - 4)((3 * A5^(2)) - A5 - 10) / (A5^(2) - 4)((3 * A6^(2)) - A6 - 10) / (A6^(2) - 4)((3 * A7^(2)) - A7 - 10) / (A7^(2) - 4)((3 * A8^(2)) - A8 - 10) / (A8^(2) - 4)((3 * A9^(2)) - A9 - 10) / (A9^(2) - 4)((3 * A10^(2)) - A10 - 10) / (A10^(2) - 4)((3 * A11^(2)) - A11 - 10) / (A11^(2) - 4)a(x) = If[-5 ≤ x ≤ 0, (2 * x) + 3]b(x) = If[0.01 ≤ x ≤ 5, (3 * (x + 1))]g(x) = (x^(3) - (2 * x^(2))) / (x^(2) - (5 * x) + 6)1.911.941.9722.022.083(D1^(3) - (2 * D1)) / (D1^(2) - (5 * D1) + 6)(D2^(3) - (2 * D2)) / (D2^(2) - (5 * D2) + 6)(D3^(3) - (2 * D3)) / (D3^(2) - (5 * D3) + 6)(D4^(3) - (2 * D4)) / (D4^(2) - (5 * D4) + 6)(D5^(3) - (2 * D5)) / (D5^(2) - (5 * D5) + 6)(D6^(3) - (2 * D6)) / (D6^(2) - (5 * D6) + 6)(D7^(3) - (2 * D7)) / (D7^(2) - (5 * D7) + 6)c(x) = sin((4 * x)) / sin((2 * x))i(x) = If[-5 ≤ x ≤ 0, g(x)]j(x) = If[0 ≤ x ≤ 5, g]00.050.06-0.05-0.061sin((4 * C12)) / sin((2 * C12))sin((4 * C13)) / sin((2 * C13))sin((4 * C14)) / sin((2 * C14))sin((4 * C15)) / sin((2 * C15))sin((4 * C16)) / sin((2 * C16))sin((4 * C17)) / sin((2 * C17))-1sin((4 * C18)) / sin((2 * C18))d(x) = If[-6.283185307179586 ≤ x ≤ 6.283185307179586, c(x)]