
Linear Regression Example 2 by Anthony Panontin
Loading the math board and drawing, please wait…
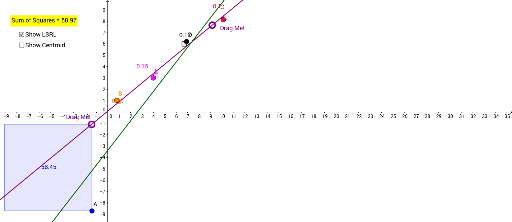
This example demonstrates how to construct a linear regression model from a set of scattered points in a Cartesian coordinate system and draw the best-fit regression line, illustrating the orthogonal projection relationship between data points and the regression line. Core mathematical concepts include linear regression, least-squares fitting, function graphing, analytic geometry line equations, orthogonal projection, and polygon construction. The construction uses GeoGebra commands Line, OrthogonalLine, Intersect, Polygon, Sum, and FitLineY, together with point objects A through R, line objects a through s, and polygon objects poly1 through poly4, building auxiliary geometric structures through intersections and polygons. Suitable for high school statistics and functions instruction, as well as university introductory data analysis and geometric modeling inquiry-based learning.
GeoGebra Commands & Parameters
Line(F, H) → aOrthogonalLine(A, xAxis) → bOrthogonalLine(E, xAxis) → cOrthogonalLine(B, xAxis) → dOrthogonalLine(D, xAxis) → eOrthogonalLine(C, xAxis) → fIntersect(b, a) → H_1Intersect(c, a) → IIntersect(d, a) → JIntersect(a, f) → KIntersect(e, a) → LPolygon(A, H_1, 4) → poly1, g, h, i, j, M, NPolygon(I, E, 4) → poly2, k, l, m, n, O, PPolygon(B, J, 4) → poly3, p, q, r, s, Q, RPolygon(L, D, 4) → poly4, t, a_1, b_1, c_1, S, TPolygon(K, C, 4) → poly5, d_1, e_1, f_1, g_1, U, VSum(A1:A5) → A6FitLineY({A, B, C, D, E}) → h_1
AI Drawing Prompt Reference
Draw a set of scattered points in a Cartesian coordinate system and plot the best-fit regression line to illustrate the orthogonal projection relationship between the data points and the regression line. Start by drawing a base line, then create perpendicular lines from multiple points to this line, connecting the intersections to form auxiliary lines. Construct several auxiliary geometric structures by connecting these points and intersections with squares. Finally, fit a regression line based on the scattered data points to complete the visualization of statistical and geometric relationships.
The prompt above was compiled from the original drawing commands and is for reference only.