
Linear Regression and Chart Example
Loading the math board and drawing, please wait…
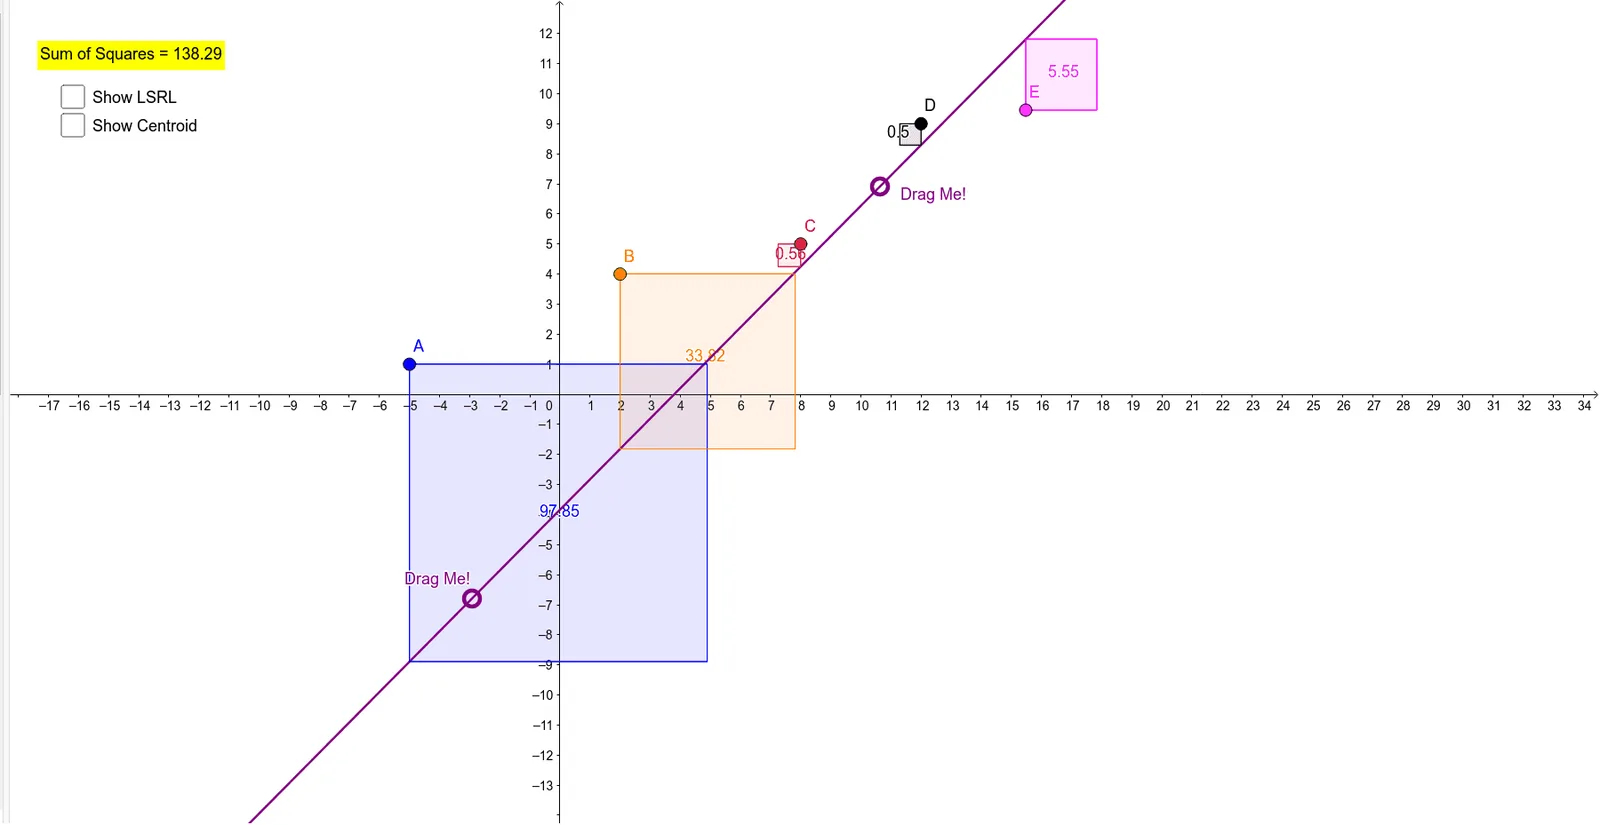
This example demonstrates how to perform linear regression analysis on data and generate charts, involving core math concepts like linear regression, pie/circle charts, roots, surfaces, logic, and dilation. It uses commands such as Line, OrthogonalLine, Intersect, Polygon, Sum, and FitLineY in GeoGebra for construction. Suitable for high school students and data analysis enthusiasts.
GeoGebra Commands & Parameters
Line(F, H) → aOrthogonalLine(A, xAxis) → bOrthogonalLine(E, xAxis) → cOrthogonalLine(B, xAxis) → dOrthogonalLine(D, xAxis) → eOrthogonalLine(C, xAxis) → fIntersect(b, a) → H_1Intersect(c, a) → IIntersect(d, a) → JIntersect(a, f) → KIntersect(e, a) → LPolygon(A, H_1, 4) → poly1, g, h, i, j, M, NPolygon(I, E, 4) → poly2, k, l, m, n, O, PPolygon(B, J, 4) → poly3, p, q, r, s, Q, RPolygon(L, D, 4) → poly4, t, a_1, b_1, c_1, S, TPolygon(K, C, 4) → poly5, d_1, e_1, f_1, g_1, U, VSum(A1:A5) → A6FitLineY({A, B, C, D, E}) → h_1
AI Drawing Prompt Reference
Draw a linear regression analysis chart featuring a line and its perpendiculars, along with several squares based on these lines. Start by drawing a line, then draw perpendicular lines from it to the X-axis, marking the intersections as H1, I, J, K, L. Form five squares using these intersection points and the feet of the perpendiculars, filling their interiors. Finally, fit a linear regression line using the points A, B, C, D, E and display it.
The prompt above was compiled from the original drawing commands and is for reference only.