
Linear Regression Example 1: Least-Squares Fit Line
Loading the math board and drawing, please wait…
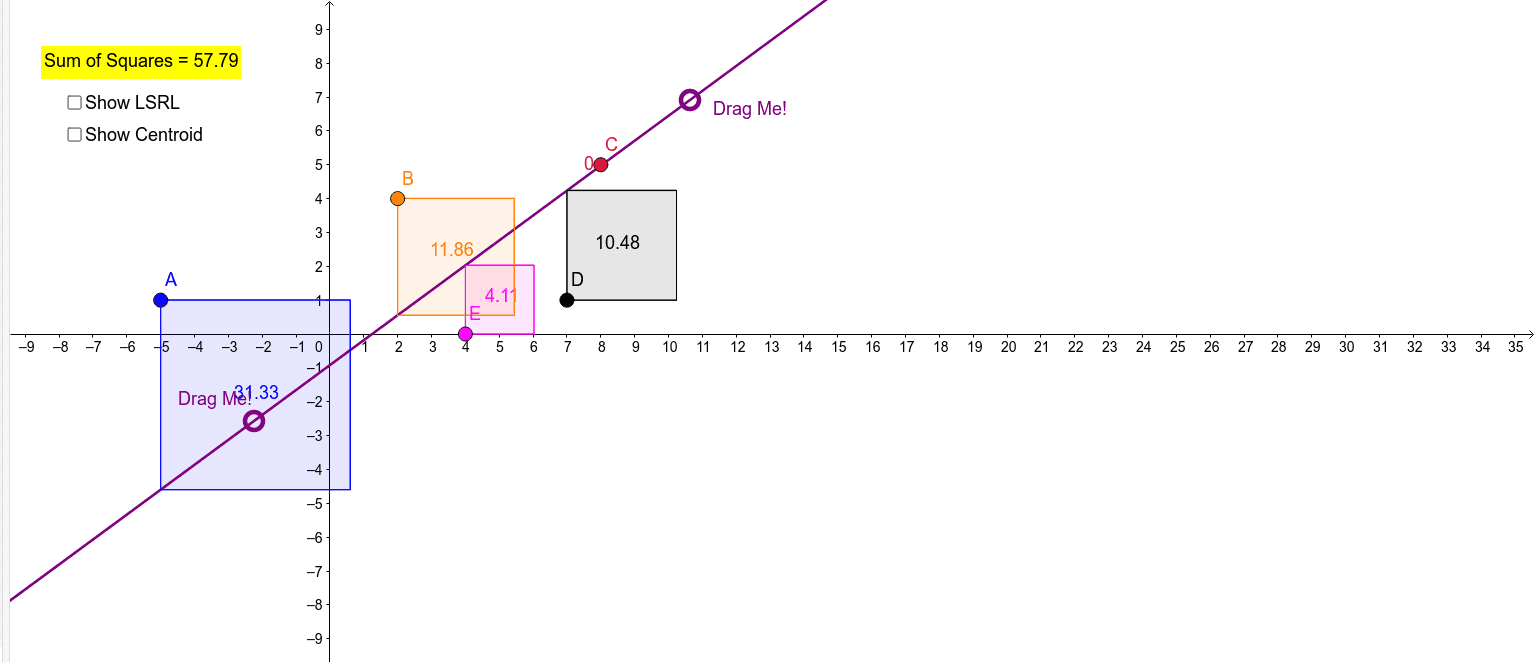
①This example demonstrates how to fit a best-fit linear regression line to a set of scattered data points, and visualizes the vertical deviations between the data points and the fitted line. ②Core mathematical concepts include linear regression, the method of least squares, the fitted line (FitLineY), and the geometric meaning of residuals (vertical distances). ③Construction highlights: The GeoGebra command FitLineY generates the regression line, while commands such as Line, OrthogonalLine, and Intersect are used to construct perpendiculars and intersection points; Polygon and Sum are used to compute the sum of squared deviations. Objects include points A, B, C, D, E, F, H, multiple auxiliary lines (a, b, c, d, e, f, g, h, i, j, k, l, m, n, p, q, r, s), and several polygons (poly1, poly2, poly3, poly4). ④Suitable for high school or introductory college statistics courses, this example helps students intuitively grasp the geometric principle of least squares and the computation of the regression line.
GeoGebra Commands & Parameters
Line(F, H) → aOrthogonalLine(A, xAxis) → bOrthogonalLine(E, xAxis) → cOrthogonalLine(B, xAxis) → dOrthogonalLine(D, xAxis) → eOrthogonalLine(C, xAxis) → fIntersect(b, a) → H_1Intersect(c, a) → IIntersect(d, a) → JIntersect(a, f) → KIntersect(e, a) → LPolygon(A, H_1, 4) → poly1, g, h, i, j, M, NPolygon(I, E, 4) → poly2, k, l, m, n, O, PPolygon(B, J, 4) → poly3, p, q, r, s, Q, RPolygon(L, D, 4) → poly4, t, a_1, b_1, c_1, S, TPolygon(K, C, 4) → poly5, d_1, e_1, f_1, g_1, U, VSum(A1:A5) → A6FitLineY({A, B, C, D, E}) → h_1