
Geometric Construction and Function Graphing
Loading the math board and drawing, please wait…
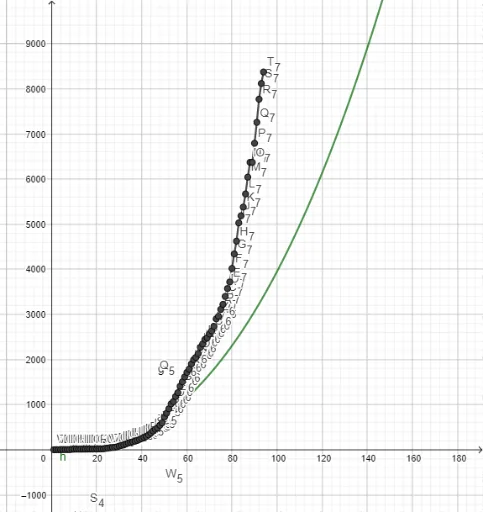
This example demonstrates the construction of multiple points and function graphs using GeoGebra, along with calculations of geometric properties. Core math concepts include median value, real numbers, tree diagrams, function graphs, and centroid. Key GeoGebra commands and objects used are f, B1-B39, functions, points, and sliders, as extracted from the construction summary. Suitable for high school mathematics education, focusing on function graphs, geometric constructions, and applications of statistics and probability.
GeoGebra Commands & Parameters
Polyline f2446666612151616161616181818182022222433394852556684991091311521671791922102312522772983313714194574845465997278139101019106911801266141015081614
AI Drawing Prompt Reference
Draw a polyline connecting a series of points with y-coordinates 2, 4, 4, 6, 6, 6, 6, 6, 12, 15, 16, 16, 16, 16, 16, 18, 18, 18, 18, 20, 22, 22, 24, 33, 39, 48, 52, 55, 66, 84, 99, 109, 131, 152, 167, 179, 192, 210, 231, 252, 277, 298, 331, 371, 419, 457, 484, with x-coordinates increasing from 1. Mark all points, and indicate the median, mode, and centroid of the point set. The overall figure combines a function graph with geometric construction, suitable for high school math education.
The prompt above was compiled from the original drawing commands and is for reference only.