
Bangladesh Coronavirus Cases 31 May
Loading the math board and drawing, please wait…
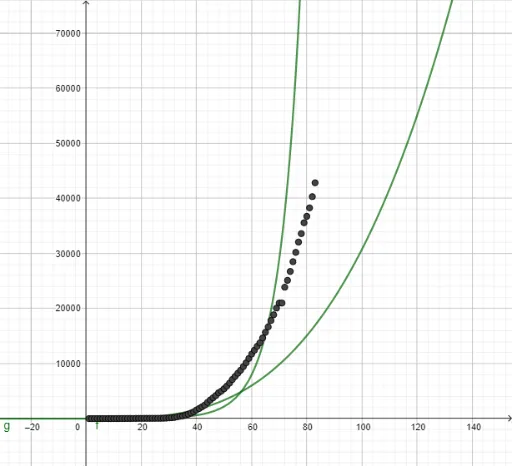
This example demonstrates the number of coronavirus cases in Bangladesh on May 31. It involves statistical characteristics and random variables. Using GeoGebra commands such as A1, B1, A2, B2, etc., the distribution of cases can be visualized. Suitable for high school or university statistics courses to help students understand the distribution and characteristics of the data.
GeoGebra Commands & Parameters
132333435363738398108111012171317142415241627173918391944204821482248234924492554265627612870298830123
AI Drawing Prompt Reference
Create a bar chart showing the distribution of coronavirus cases in Bangladesh on May 31. Start by drawing the x-axis and y-axis. Mark May 31 on the x-axis and the number of cases on the y-axis. Then, draw bars representing the number of cases in different regions or types, with the height of each bar corresponding to the number of cases. Finally, add a title and legend for better understanding of the chart.
The prompt above was compiled from the original drawing commands and is for reference only.