
Line of Best Fit with Least Squares
Loading the math board and drawing, please wait…
In collections
Statistics & Probability
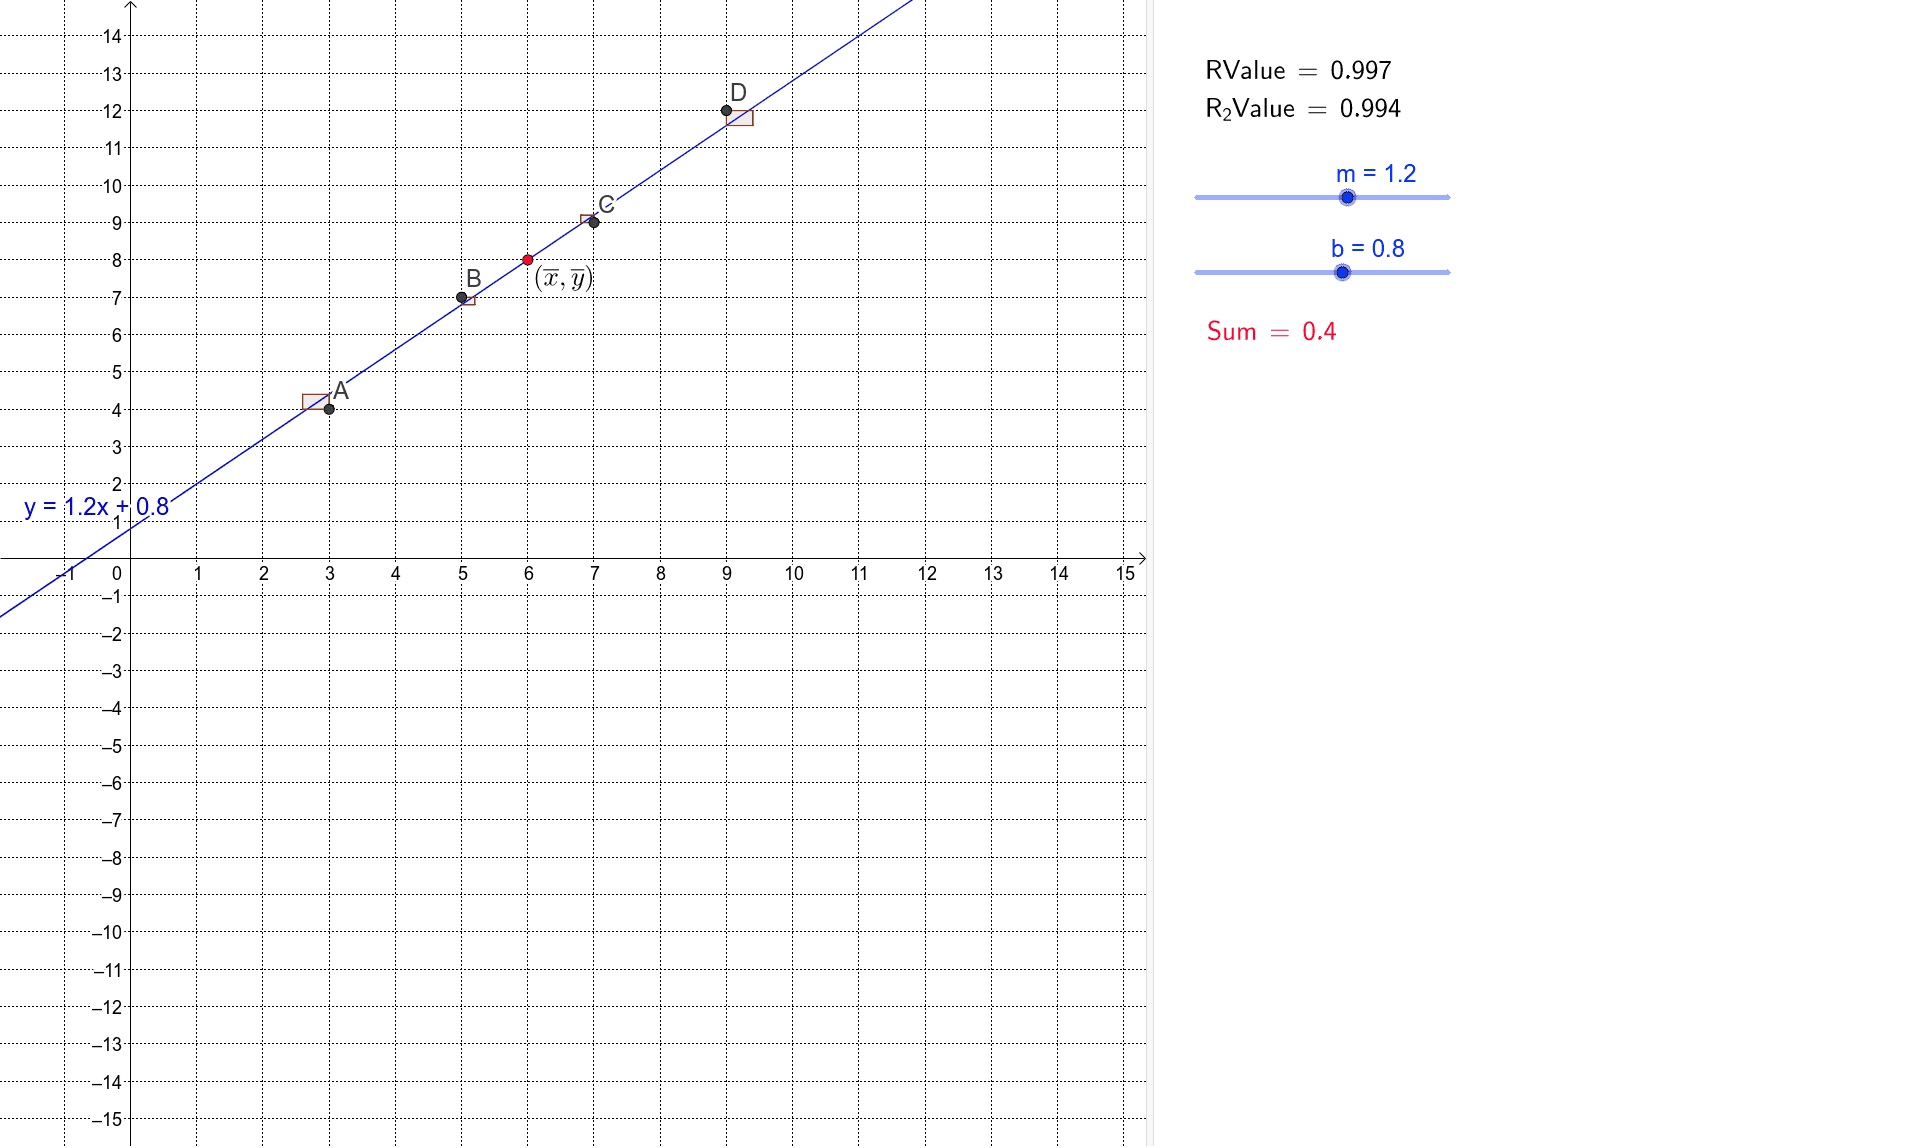
This example demonstrates how to fit a best-fit line to scatter data using the method of least squares, visually showing that the sum of squared residuals is minimized. Core mathematical concepts include linear regression, the least-squares criterion, residuals, the Pearson correlation coefficient (PMCC), and the mean point. Construction highlights: GeoGebra commands such as OrthogonalLine create perpendicular residual segments, Intersect finds intersection points, Polygon builds squares representing squared residuals, Sum computes the total squared error, Mean calculates data averages, and PMCC gives the correlation coefficient. Objects include data points A2 through B5, line parameters m and b, residual segments, and rectangles poly1. Suitable for high school or introductory college statistics, helping students understand the derivation and optimality of the regression line.
GeoGebra Commands & Parameters
OrthogonalLine(A, xAxis) → cOrthogonalLine(B, xAxis) → dOrthogonalLine(C, xAxis) → eOrthogonalLine(D, xAxis) → fIntersect(a, c) → EIntersect(a, d) → FIntersect(a, e) → GIntersect(a, f) → HPolygon(A, E, 4) → poly1, a_1, e_1, g, h, I, JPolygon(B, F, 4) → poly2, b_1, f_1, i, j, K, LPolygon(C, G, 4) → poly3, c_1, g_1, k, l, M, NPolygon(D, H, 4) → poly4, d_1, h_1, n, p, O, PSum(list2) → SumLaTeX(Sum, true, true) → text1PMCC(list1) → RValueLaTeX(RValue, true, true) → text2LaTeX(R_2Value, true, true) → text3LaTeX(RValue, true, true) → text4Mean(A2:A5) → A6Mean(B2:B5) → B6
AI Drawing Prompt Reference
Draw a set of scatter points from A2 to B5, then fit a best-fit line using the least squares method. Construct perpendicular lines c, d, e, f to the x-axis, intersecting line a at points E, F, G, H. Use these points to build four rectangles representing squared residuals, calculate the total squared error and display it. Compute the Pearson correlation coefficient and display it.
The prompt above was compiled from the original drawing commands and is for reference only.