
Function Graphing and Statistical Analysis
Loading the math board and drawing, please wait…
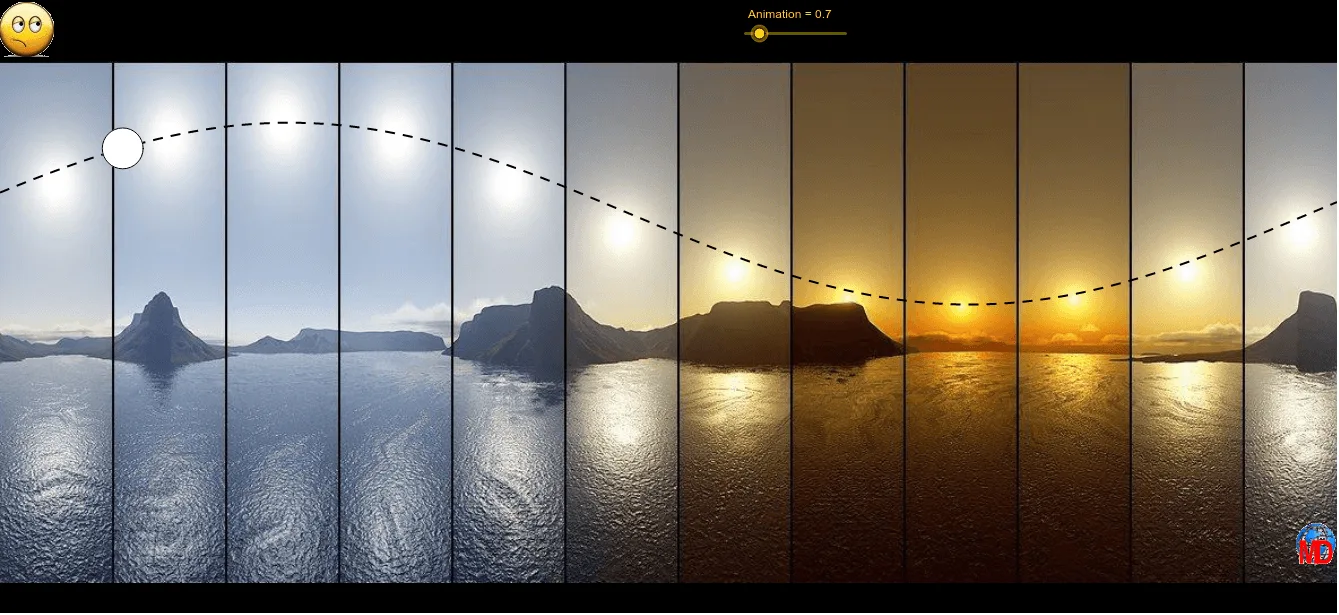
This example demonstrates how to graph the function f(x)=sun(x) using GeoGebra and analyze its statistical characteristics. Core math concepts include function graphing, quadratic functions, median value, and statistical properties. It utilizes GeoGebra commands like Function, Circle, and objects such as image1, image2, image3, A, a, B, amp, w, b, c, f, p, t, C, Animation, d, e, g. Suitable for high school mathematics teaching on function graphing and data analysis.
GeoGebra Commands & Parameters
Function(f, x(A), x(B)) → pCircle(C, 0.45) → dCircle(C, 0.45) → eCircle(C, 0.45) → g
AI Drawing Prompt Reference
Draw a graph of the function f(x)=sun(x), and include two concentric circles centered at the graph's center with a radius of 0.45, using distinct colors for the three circles to visually separate them, creating a combined visual of function graphing and geometric statistical analysis.
The prompt above was compiled from the original drawing commands and is for reference only.