
Least-Squares Regression Line Demonstration
Loading the math board and drawing, please wait…
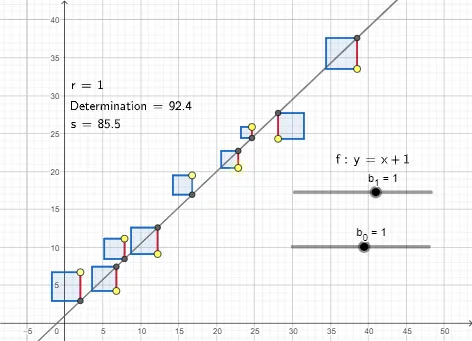
This example demonstrates how to plot the least-squares regression line on a coordinate plane, intuitively showing the relationship between scatter plot data and the regression line. The core mathematical concept is the Least Squares Method, which determines the intercept b₀ and slope b₁ by minimizing the sum of squared vertical distances from observations to the line. Construction key points: Use GeoGebra's LaTeX command to display the regression equation and correlation coefficient r, apply PMCC to calculate Pearson's product-moment correlation coefficient, use Segment commands to draw residual lines from data points to the regression line, and employ Polygon to visualize data point distribution. Suitable for high school or university statistics courses, useful for teaching linear correlation concepts, demonstrating regression analysis principles, and practicing data analysis skills.
GeoGebra Commands & Parameters
LaTeX(f, true, true) → text1PMCC({A, B, C, D, E, F, G, H, I}) → rLaTeX(r, true, true) → text2Segment(A, A_{1}) → kSegment(I, I_{1}) → lSegment(E, E_{1}) → mSegment(G, G_{1}) → nSegment(C, C_{1}) → pSegment(H, H_{1}) → qSegment(B, B_{1}) → tSegment(D, D_{1}) → f_1Polygon(I, I_{1}, 4) → poly1, g_1, h_1, i_1, j_1, J, KPolygon(A_{1}, A, 4) → poly2, k_1, l_1, m_1, n_1, L, MPolygon(E_{1}, E, 4) → poly3, p_1, q_1, r_1, s_1, N, OPolygon(C_{1}, C, 4) → poly4, t_1, a_1, c_1, d_1, P, QPolygon(F_{1}, F, 4) → poly5, e_1, f_2, g_2, h_2, R, SPolygon(B_{1}, B, 4) → poly6, i_2, j_2, k_2, l_2, T, UPolygon(G, G_{1}, 4) → poly7, m_2, n_2, p_2, q_2, V, WPolygon(H, H_{1}, 4) → poly8, r_2, s_2, t_2, a_2, Z, J_1Polygon(D, D_{1}, 4) → poly9, b_2, c_2, d_2, e_2, K_1, L_1LaTeX(Determination, true, true) → text3LaTeX(s, true, true) → text4
AI Drawing Prompt Reference
Draw a coordinate plane with a scatter plot of data points. Add a least-squares regression line through the points. From each data point, draw a vertical residual segment down to the regression line, and shade the area between each point and the line using semi-transparent rectangles or squares to emphasize the vertical distances. Display text near the graph showing the regression equation, correlation coefficient, coefficient of determination, and standard deviation. The overall scene should illustrate the concept of least-squares regression in a statistics classroom.
The prompt above was compiled from the original drawing commands and is for reference only.