
Histogram Construction Example by gocemenbusra
Loading the math board and drawing, please wait…
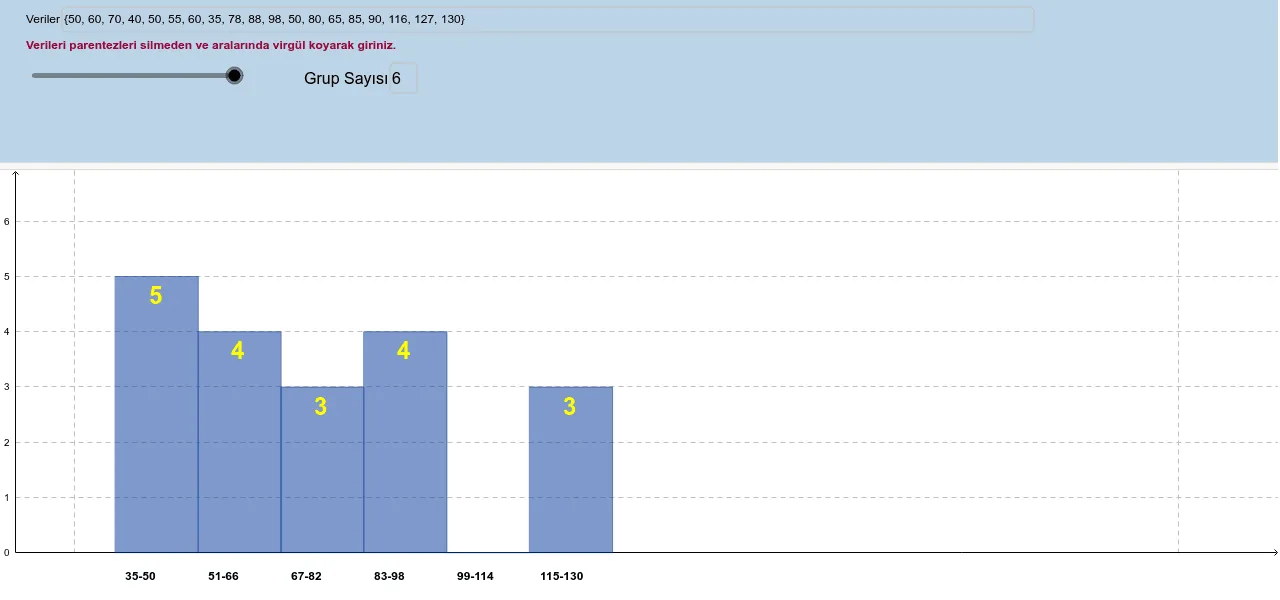
This example demonstrates how to create a histogram using GeoGebra, visually representing data distribution. Core math concepts include data statistics, frequency distribution, central tendency (mean, median), and standard deviation. Construction highlights the use of commands like Sequence, Min, Max, CountIf, and Textfield, along with objects such as a, B2, liste2, etc. Suitable for high school mathematics and introductory statistics, ideal for data analysis and visualization teaching.
GeoGebra Commands & Parameters
Sequence(((a * i) - (a * 0.5), 0), i, 1, B2) → liste2Sequence(((a * i) + (a * 0.5), 0), i, 1, B2) → liste3Sequence((x(Element[liste2, i]) + x(Element[liste3, i])) / 2, i, 1, B2) → liste12Min(liste1) → B6Max(liste1) → B5CountIf(M15 ≤ x ≤ M16, liste1) → M18CountIf(L15 ≤ x ≤ L16, liste1) → L18CountIf(K15 ≤ x ≤ K16, liste1) → K18CountIf(J15 ≤ x ≤ J16, liste1) → J18CountIf(I15 ≤ x ≤ I16, liste1) → I18CountIf(H15 ≤ x ≤ H16, liste1) → H18CountIf(G15 ≤ x ≤ G16, liste1) → G18CountIf(F15 ≤ x ≤ F16, liste1) → F18CountIf(E15 ≤ x ≤ E16, liste1) → E18CountIf(D15 ≤ x ≤ D16, liste1) → D18CountIf(C15 ≤ x ≤ C16, liste1) → C18CountIf(B15 ≤ x ≤ B16, liste1) → B18Sequence(((a * i) + (a * 0.5), Element[liste4, i]), i, 1, B2) → liste6Sequence(((a * i) - (a * 0.5), Element[liste4, i]), i, 1, B2) → liste5Sequence((x(Element[liste5, i]) + x(Element[liste6, i])) / 2, i, 1, B2) → liste11Sequence(y(Element[liste6, i]) - 0.5, i, 1, B2) → liste10Sequence(Polygon[Element[liste2, i], Element[liste3, i], Element[liste6, i], Element[liste5, i]], i, 1, B2) → liste7Textfield(B2) → MetinAlanı1Sequence((Element[liste12, i] - (a * 0.38), (-0.5)), i, 1, B2) → liste8Sequence((Element[liste11, i] - (a * 0.1), Element[liste10, i]), i, 1, B2) → liste9Textfield(B2) → MetinAlanı1_1Textfield(liste1) → Veriler