
LR8-01-CYU5 (Lines of Best Fit)
Loading the math board and drawing, please wait…
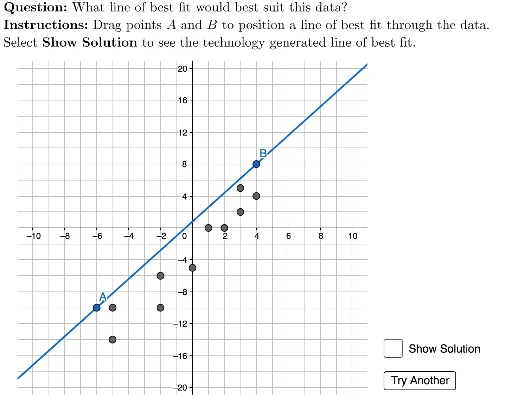
① This interactive GeoGebra example demonstrates how to draw a line of best fit on a scatter plot, with automatic feedback on the user's drawn line. ② Core mathematical concepts include linear regression, scatter plots, residuals, and the intuitive idea of minimizing vertical distances between data points and the line. ③ Construction highlights: the FitLineY command computes the least-squares regression line; Polygon and PointIn are used to check whether data points lie above or below the user's line; Zip and Element manage point lists; LaTeX renders the question text; Line and slider-like variables enable interactive dragging; script variables (questionList, currentPoints, lineOfBestFit) support multiple randomized questions. ④ Suitable for middle school to high school students learning statistics and linear regression, as well as for classroom demonstrations or self-paced practice to connect visual estimation with formal regression methods.
GeoGebra Commands & Parameters
Polygon({(-11, -21), (-11, 21), (11, 21), (11, -21)}) → viewBoxLaTeX((((("\text{" * QUESTION) * "\\") * INSTRUCTIONS) * "}")) → TEXTElement(questionList, questionListIndex) → questionNumElement(A2:A5, questionNum) → currentXsElement(B2:B5, questionNum) → currentYsZip((A, B), A, currentXs, B, currentYs) → currentPointsFitLineY(currentPoints) → lineOfBestFitPointIn(viewBox) → APointIn(viewBox) → BLine(A, B) → usersLine