
Inequalities on Number Lines
Loading the math board and drawing, please wait…
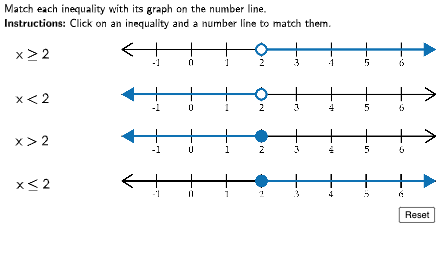
This example demonstrates inequalities on number lines. Key mathematical concepts include inequalities and their representation on number lines. Using GeoGebra commands such as Segment and Inequality, the construction of inequality graphs is illustrated. Suitable for students in middle school and above to learn about inequalities and graphing methods.
GeoGebra Commands & Parameters
LaTeX(((((" \text{" * QUESTION) * "\\") * INSTRUCTION) * "}")) → TEXTSegment(IneqPts(1), GraphPts(1)) → Line11Segment(IneqPts(1), GraphPts(2)) → Line12Segment(IneqPts(1), GraphPts(3)) → Line13Segment(IneqPts(1), GraphPts(4)) → Line14Segment(IneqPts(2), GraphPts(1)) → Line21Segment(IneqPts(2), GraphPts(2)) → Line22Segment(IneqPts(2), GraphPts(3)) → Line23Segment(IneqPts(2), GraphPts(4)) → Line24Segment(IneqPts(3), GraphPts(1)) → Line31Segment(IneqPts(3), GraphPts(2)) → Line32Segment(IneqPts(3), GraphPts(3)) → Line33Segment(IneqPts(3), GraphPts(4)) → Line34Segment(IneqPts(4), GraphPts(1)) → Line41Segment(IneqPts(4), GraphPts(2)) → Line42Segment(IneqPts(4), GraphPts(3)) → Line43Segment(IneqPts(4), GraphPts(4)) → Line44
AI Drawing Prompt Reference
Draw a number line with inequality representations. Place four key points for inequalities and four corresponding graph points. Connect each key point to every graph point with straight line segments, creating a total of sixteen lines. These lines form a grid-like pattern that illustrates the relationships between the inequality points and their graphical counterparts, aiding in the visualization of inequality intervals on the number line.
The prompt above was compiled from the original drawing commands and is for reference only.