
Interactive Visualization of a Cone’s Volume
Loading the math board and drawing, please wait…
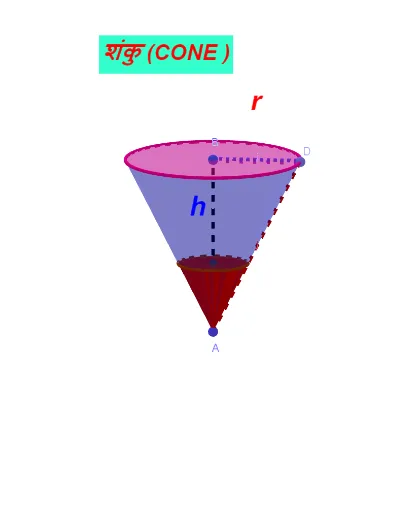
This example presents an interactive geometric model that visualizes how the volume of a cone changes with its key dimensions (notably height and base radius) and ties these parameters to related functional/curve relationships. The core mathematics includes the cone’s geometric parameters, the volume formula V = (1/3)πr²h, and the idea of using functions/graphing or curve sketching to express how volume depends on variables. Construction-wise, it uses GeoGebra commands reflected in the build summary: Cone (to create the 3D cone), Segment (to form defining measurement/reference edges), Point (to place and control key parameters), Volume (to compute the solid’s volume), and PointIn (to support point-in-solid logic for interactive evaluation). Additional point objects and text labels (e.g., text1, text2, etc.) are used to display parameters and computed volume, while buttons/controls update the shown results (e.g., the volume display object). Suitable for secondary school through early college, especially for solid geometry instruction, concept reinforcement, and visualization-based learning.
GeoGebra Commands & Parameters
Cone(B, A, 2) → a, c, bCone(C, A, h / 2) → d, e, fSegment(B, C) → gPoint(c) → DSegment(B, D) → iSegment(D, A) → jVolume(d) → volumedPointIn(f) → Pointf
AI Drawing Prompt Reference
Create an interactive 3D visualization of a cone’s volume. First construct a cone using its base and apex, then set up reference segments that represent key measurement edges derived from the cone’s dimensions. Introduce controllable parameter points related to the cone’s height and base radius, and use them to define two corresponding size configurations. Display the computed cone volume as a live readout linked to the chosen parameters. Also include an interactive point-in-solid element to support whether a point lies inside the cone, and add text annotations showing the relevant parameters and the resulting volume. Organize the build by creating the cone and reference structure first, then adding control points and the volume computation, and finally the inside-point evaluation and labels.
The prompt above was compiled from the original drawing commands and is for reference only.