
Geometric Visualization of an Irish Logarithm (Log-Scale Construction)
Loading the math board and drawing, please wait…
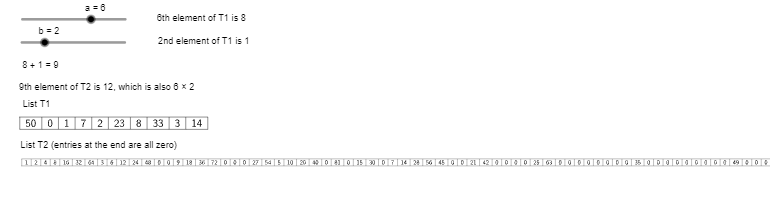
This example demonstrates the “Irish Logarithm” idea by combining a geometry construction with a labeled numerical table, making the log-scale behavior visually understandable. It highlights how logarithms convert multiplication/division into addition/subtraction on a suitable scale. The core concepts are logarithms and their functional structure (logarithmic/ exponential equivalence), proportional relationships underlying multiplication and division, and the use of measured lengths as geometric proxies for numeric quantities. Construction-wise, it uses GeoGebra commands Element, Length, and TableText: Element selects and references key objects (e.g., t1, t2 and geometric parameters a–f), Length computes the relevant distance measures from those objects, and TableText formats the extracted values into a readable table. The included text objects (text1–text8) provide the necessary labels to connect the geometry with the log values. Suitable for secondary to early university students learning logarithmic functions, as well as for interactive graphing/geometry-based exploration.
GeoGebra Commands & Parameters
Element(t1, a + 1) → eElement(t1, b + 1) → cLength(t2) → fElement(t2, e + c + 1) → dTableText(t1, "|_") → text1TableText(t2, "_|") → text2
AI Drawing Prompt Reference
Please draw a geometric visualization of a logarithmic scale. The drawing should include a construction using lengths and elements to represent numbers. Also include a table with labels for logarithmic values. Ensure the drawing is clear to show how logarithms convert multiplication and division into addition and subtraction. This is suitable for teaching basic concepts of logarithmic functions.
The prompt above was compiled from the original drawing commands and is for reference only.