
Interactive Two-Way Frequency Chart
Loading the math board and drawing, please wait…
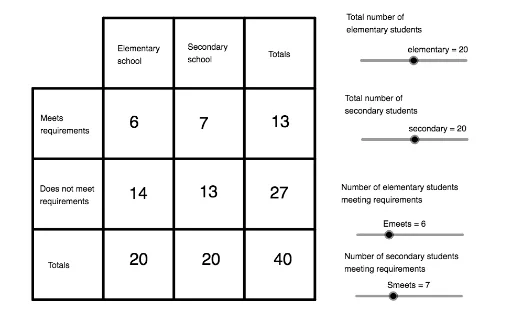
This example demonstrates a two-way frequency table where students can manipulate the table to observe relationships between cells. It involves core math concepts in Probability & Statistics. Construction uses commands like Segment and objects including letters A-Z, f-p, and text elements text1-text5. Suitable for high school statistics education or introductory data analysis learning.
GeoGebra Commands & Parameters
Segment(U, Z) → fSegment(T, P) → gSegment(I, Q) → hSegment(E, R) → iSegment(A, S) → jSegment(T, A) → kSegment(U, B) → lSegment(V, C) → mSegment(W, D) → nSegment(Z, S) → p
AI Drawing Prompt Reference
Draw an interactive two-way frequency chart with intersecting horizontal and vertical lines forming a grid, connect points on the diagonals with line segments, and label key positions to demonstrate core concepts in probability and statistics, start by creating the basic grid, then connect the diagonals, and finally label the key points.
The prompt above was compiled from the original drawing commands and is for reference only.