
Hyperbolic Function Exploration
Loading the math board and drawing, please wait…
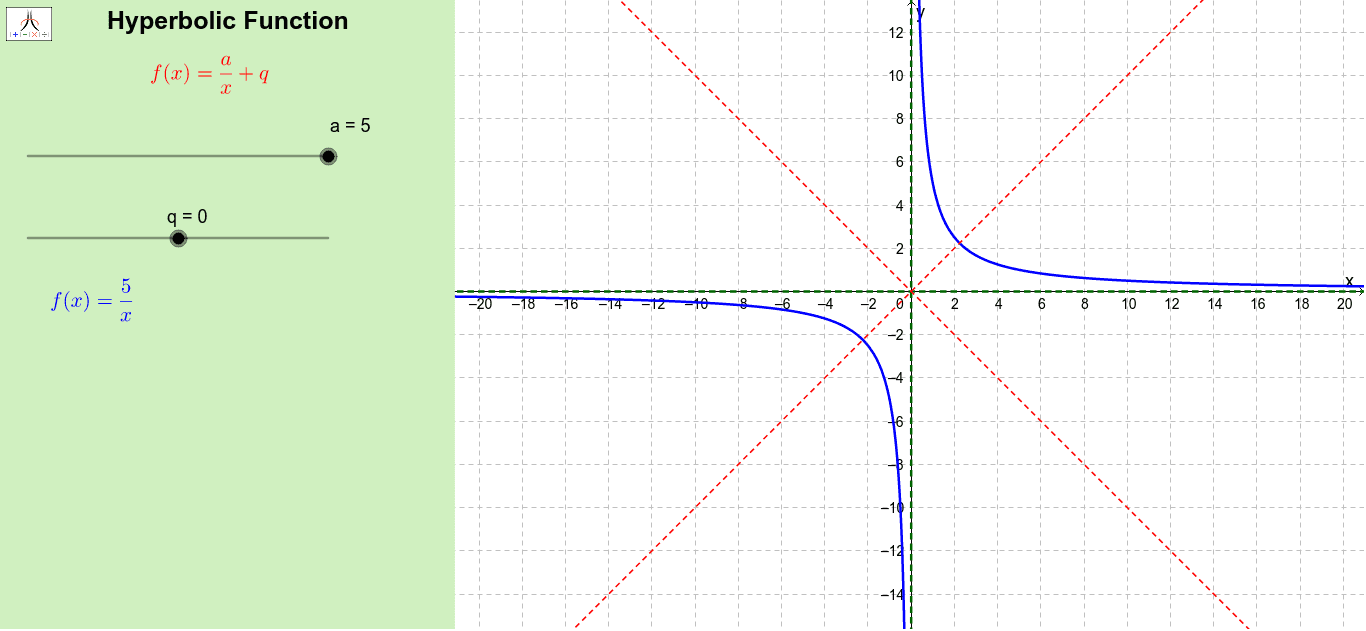
This example demonstrates the graph of hyperbolic functions and their asymptotes. It involves core math concepts like hyperbolic functions, asymptotes, quadrilaterals, probability & statistics, upper and lower sum or Riemann sum, and arithmetic mean. Constructed using GeoGebra commands such as Asymptote, Corner, and Polygon. Suitable for Grade 10 students under the CAPS curriculum.
GeoGebra Commands & Parameters
Asymptote(g) → AsmptCorner(1, 1) → Cnr1Corner(1, 2) → Cnr2Corner(1, 3) → Cnr3Corner(1, 4) → Cnr4Polygon(CN1, CN2, CN3, CN4) → Panel, cn1, cn2, cn3, cn4Polygon(Cnr1, Cnr2, Cnr3, Cnr4) → Frame, cnr1, cnr2, cnr3, cnr4
AI Drawing Prompt Reference
Draw a graph showing hyperbolic functions and their asymptotes, including a rectangle formed by four vertices and two quadrilaterals, filled with different colors, with asymptotes represented as dashed lines, clearly displaying the geometric properties of hyperbolic functions.
The prompt above was compiled from the original drawing commands and is for reference only.