
Sine Function Transformations by Philip Collett
Loading the math board and drawing, please wait…
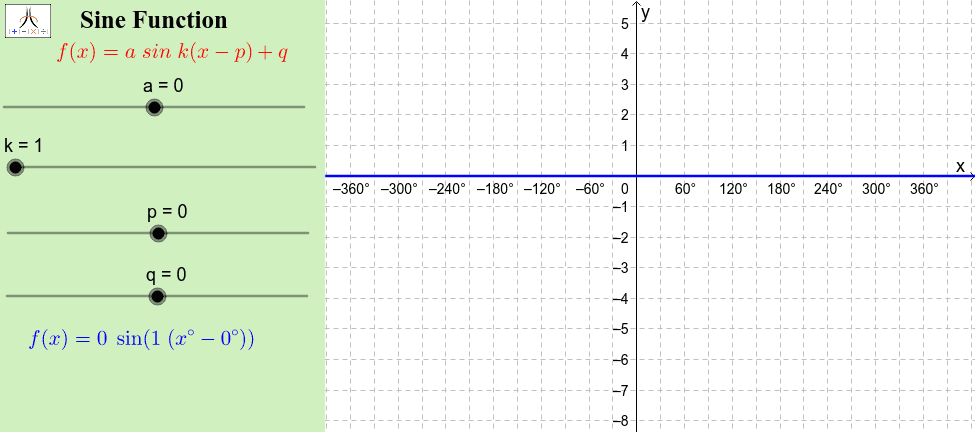
This example demonstrates the effects of horizontal and vertical transformations on the sine function graph. Key math concepts include sine function graph, horizontal translation, vertical scaling. It is constructed using GeoGebra commands like Corner (vertices), Polygon, and Slider for animation. Suitable for high school students to learn function transformation properties and introductory calculus concepts.
GeoGebra Commands & Parameters
Corner(1, 1) → Cnr1Corner(1, 2) → Cnr2Corner(1, 3) → Cnr3Corner(1, 4) → Cnr4Polygon(CN1, CN2, CN3, CN4) → Panel, cn1, cn2, cn3, cn4Polygon(Cnr1, Cnr2, Cnr3, Cnr4) → Frame, cnr1, cnr2, cnr3, cnr4
AI Drawing Prompt Reference
Draw a sine function graph and demonstrate the effects of horizontal and vertical transformations, using a slider for animation. Start by drawing a square frame, then fill it with a polygon, and mark the vertices with key points to highlight the mathematical concepts of function transformations.
The prompt above was compiled from the original drawing commands and is for reference only.