
Graphical Exploration of Modulus Inequalities
Loading the math board and drawing, please wait…
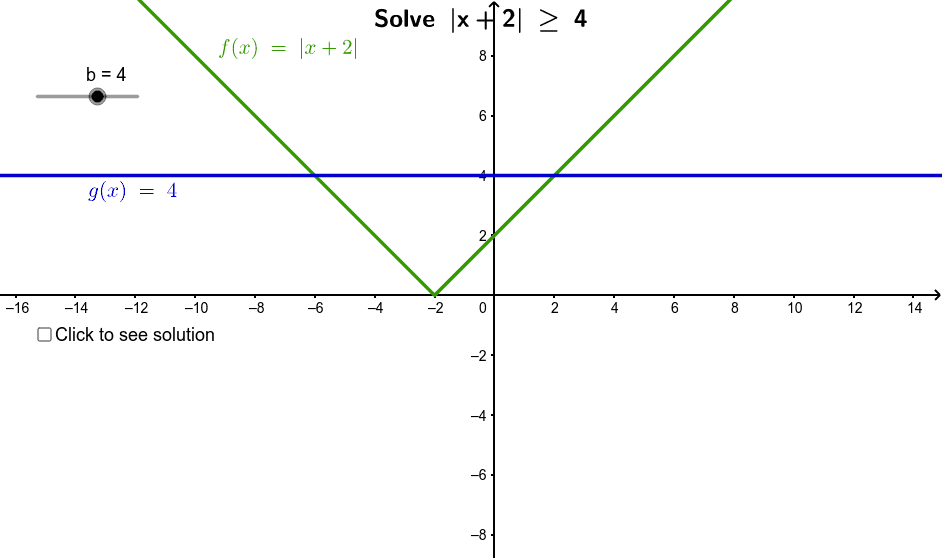
This GeoGebra example dynamically illustrates the solution sets of modulus (absolute value) inequalities through graphical representation, showing how the absolute value function intersects with linear functions to define inequality regions. Core mathematical concepts include absolute value definition, solving inequalities, function graph intersections, and interval notation. Construction highlights: the Intersect command is used to find intersection points A and B of functions f and g, while the Function command defines the absolute value and linear functions; sliders or parameters allow adjusting the inequality direction to observe solution set changes in real time. Suitable for high school students learning inequalities and function graphs, as well as pre-university review, this example bridges algebraic solving and geometric visualization of modulus inequalities.
GeoGebra Commands & Parameters
Intersect(f, g, (-6, 4)) → AIntersect(f, g, (2, 4)) → BFunction(f, -30, e) → pFunction(f, h, Infinity) → q
AI Drawing Prompt Reference
Draw the absolute value function |x| and two lines y = x + 4 and y = -x + 2, use sliders to adjust the slope and intercept of the lines, observe the solution sets for the inequalities |x| > x + 4 and |x| < -x + 2, and mark the intersection points of the two lines.
The prompt above was compiled from the original drawing commands and is for reference only.