
Quadratic Inequalities Demo by Folens Publishers
Loading the math board and drawing, please wait…
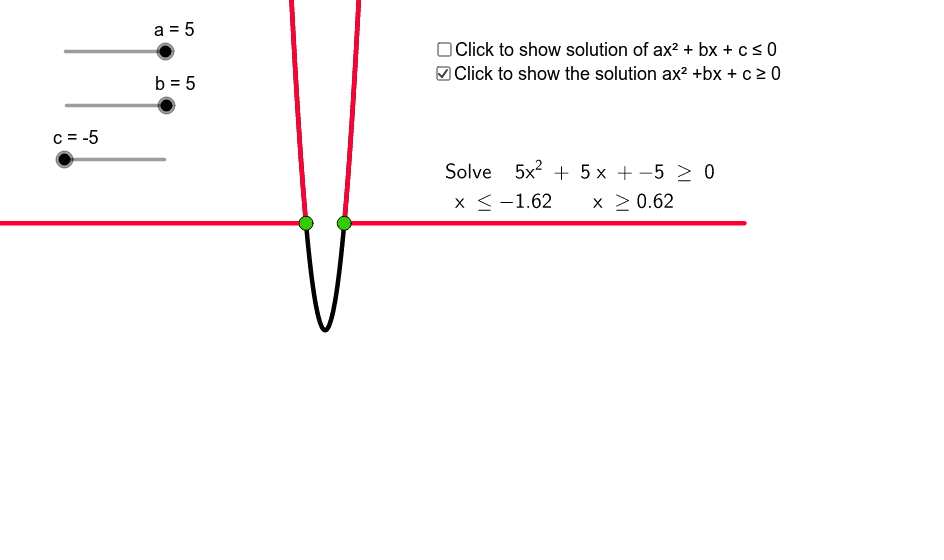
This example demonstrates the solution set of quadratic inequalities in the coordinate system. It involves core mathematical concepts such as quadratic functions, inequality solution sets, function graphs, and regions. Construction highlights include using GeoGebra commands like Function, Root, and Segment, along with objects a, b, c, d, f, e, g, h, text1, A, B, p, i, C, j, D, k, text2, l, m, text3, text4 to plot function graphs, mark key points, and construct shapes. It is suitable for high school students learning about the geometric meaning and solving methods of quadratic inequalities.
GeoGebra Commands & Parameters
Function(f, e, d) → gFunction(f, d, Infinity) → hRoot(f) → A, BFunction(f, -20, e) → pSegment(A, B) → iSegment(A, C) → jSegment(B, D) → k
AI Drawing Prompt Reference
Draw a quadratic function's graph in a coordinate system and highlight its solution set. Plot the function, find its roots, and connect them with a line. Add two auxiliary lines and shade the regions above and below the graph in different colors to show the inequality's solution set.
The prompt above was compiled from the original drawing commands and is for reference only.